Does Credit Aect Deforestation?
Evidence from a Rural Credit Policy in the
Brazilian Amazon
CPI Technical Report
Climate Policy Initiative
Juliano Assunção
Clarissa Gandour
Romero Rocha
Rudi Rocha
January 2013

About CPI
Climate Policy Initiative (CPI) is a policy eectiveness analysis and advisory organization whose
mission is to assess, diagnose, and support the eorts of key governments around the world to
achieve low-carbon growth.
CPI is headquartered in San Francisco and has oces around the world, which are aliated
with distinguished research institutions. Oces include: CPI Beijing aliated with the School
of Public Policy and Management at Tsinghua University; CPI Berlin; CPI Hyderabad, aliated
with the Indian School of Business; CPI Rio, aliated with Pontifical Catholic University of
Rio (PUC-Rio); and CPI Venice, aliated with Fondazione Eni Enrico Mattei (FEEM). CPI is an
independent, not-for-profit organization that receives long-term funding from George Soros.
Descriptors
Sector Forestry and Land Use
Region Brazil
Keywords credit, land use, deforestation, conservation policies
Contact Juliano Assunção, CPI Rio
JEL codes Q23, Q24, Q28
Copyright © 2013 Climate Policy Initiative www.climatepolicyinitiative.org
All rights reserved. CPI welcomes the use of its material for noncommercial
purposes, such as policy discussions or educational activities, under a Creative
Commons Attribution-NonCommercial-ShareAlike 3.0 Unported License.
For commercial use, please contact admin@cpisf.org.
Author Aliations
J. Assunção, C. Gandour, Romero Rocha: Núcleo de Avaliação de Políticas Climáticas da
Pontifícia Universidade Católica do Rio de Janeiro (NAPC/PUC-Rio) & Climate Policy
Initiative Rio de Janeiro (CPI Rio)
Rudi Rocha: Universidade Federal do Rio de Janeiro (UFRJ)

Abstract
The concession of rural credit in the Brazilian Amazon became conditional upon stricter legal and
environmental requirements in 2008. This paper uses this policy change to investigate credit
constraints in the region, and how the variation in credit impacts deforestation. Dierences-in-
dierences estimation based on a panel of municipalities shows that the policy change led to a
reduction in rural credit, particularly for cattle ranching. The eect is concentrated on medium and
large loans. A two-stage estimation shows that the decrease in rural credit has curbed deforesta-
tion, especially in municipalities where cattle ranching is the main economic activity.
1. Introduction
How does the availability of rural credit affect defo restati on ? Theory alone offers
ambiguous answers to this question. On the one hand, should credit be used to increase
rural production by incorpora ting new lands for production, g reater availability of credit
will likely lead to rising deforesta tion, as forest areas are cleared and converted into
agricultural land. On the other hand, should it be used to fund the capital expenditures
required to improve agricultural technology and productivity, increases in availability of
rural credit may actually reduce land use and curb deforestation.
This paper shows that a reduction in rural credit has contributed to curb deforestatio n
in the Brazilian Amazon Biome. The evidence is provided by the evaluation of Resolu-
tion 3,545, introduced in 2008 by the Brazilian National Monetary Council (Conselho
Monetário Nacional, CMN). This resolution conditioned the concession of rural credit in
the Amazon Biome upon proof of compliance with legal and environmental regulations.
We investigate several aspects of b oth the implementation and impact of this novel credit
policy, and explore variations in rural credit concessions caused by this new regulation to
estimate the effect of credit on deforestation.
We interpret the impact of credit on deforestation as evidence of credit constraints in
the region. Based on Banerjee and Duflo (2012), we argue that this potential rationing
in the availability of subsidized credit may have tightened credit constraints, leading to
changes in farmers’ production decisions and thereby affecting deforestation. We develop
a very stylized econo mic model, which guides the interpretation of our results, showing
how a change in the availability of subsidized credit may either increase o r decrease forest
clearings.
Our results have two key policy implications. First, the evidence shows that condi-
tional rural credit can be an effective policy instrument to combat deforestation. Second,
and perhaps more important, our analysis suggests that the financial environment in the
Amazon is characterized by significant credit constraints. Thus, policies that increase the
availability of financia l resources may potentially lead to higher deforestation rates. This
issue lies at the core of the recent debate about REDD policies that ultimately invo lve
payments for environmenta l services (see Alston and Andersson (2011), Angelsen (201 0 ),
and Angelsen and Wertz-Kanounnikoff (2008)).
Rural credit is an important source of funding for Brazilian agriculture, as well as
akeypolicyinstrumentinthecountry. Ruralcreditissubsidizedbythegovernment.
When Resolution 3,545 was implemented in 2008, the rural credit portfolio proposed by
the federal government and carried out by official banks and credit cooperatives totaled
BRL 78 billion (USD 38.5 billion) for all of Brazil. In that same year, the Amazon Biome
portfolio provided BRL 2.5 billion (USD 1.24 billion) in rural credit. In this region,
rural credit is distributed mostly through government banks, such as Banco do Brasil,
2
Banco da Amazônia and Banco do Nordeste. According to MAPA (2003), the official
rural credit portfolio covers about a third of the annual financia l needs of the agricultural
sector in Brazil. As part of these needs are covered by producers’ own resources, this
portfolio represents an even larger share of external finance in the sector. Thus, any policy
measure that affects rural credit also affects one of Brazil’s main support mechanisms for
agricultural production.
Three key aspects in the implementation of Resolution 3,545 helped us design our
empirical analysis. First, its conditions applied only to rural credit used in landhold-
ings inside the Amazon Biome. Having access to b oth contract-level credit concession
microdata and deforestation satellite data for all of the Legal Amazon (a larger admin-
istrative region), we are able to use Legal Amazon municipalities that are not in the
Amazon Biome as a control group to evaluate the impact of the resolution in the biome.
This aspect allows us to use a difference-in-differences approach for the evaluation of the
resolution.
Second, credit takers who were beneficiaries of the National Program for the Strength-
ening of Family Agriculture (Programa Nacional de Fortalecimento da Agricultura Fa-
miliar, Pronaf) were subject to far less stringent conditions for credit concession. Pronaf
is designed to target sma ll-sca le producers, where eligibility for the program depends on
the producer’s farm size. As our data allows us to identify whether credit was contracted
through Pronaf or non-Pronaf channels, we explore how, for a given municipality, credit
concession differed between small and mid-to-large-scale pro ducers after the adoption of
Resolution 3,545. We explore this second aspect in an alternative difference-in-differences
formulation.
Third, the resolution’s conditions were such that borrowers who proved that they
had the intention to comply with environmental regulation were allowed access to credit.
The key requirement was a formal commitment to adapt to the environmental rules over
time rather than at the current time. For practical purposes, this made intention to
comply equivalent to compliance, helping us validate our strategy for the estimation of
the relationship between credit and deforestation. A possible concern for our identifica-
tion strategy co uld arise from financially unconstrained farmers changing their choices
about deforestation to prevent future credit restrictions. The way Resolution 3 ,5 4 5 was
implemented mitigates the relevance of this issue.
Our analysis is based on a contra ct-level microdata set compiled by the Central Bank
from Common Registry of Rural Operations (Registro Comum de Operações Rurais,
Recor) data. This data set contains detailed information on all rural credit contracts
negotiated by official banks (public and private) and credit cooperatives in the 2002
through 2011 period in the Legal Amazon states of Acre, Amazonas, Amapá, Ma ra nhã o ,
Mato Grosso, Pará, Rondônia, Roraima and Tocantins. We use this data to construct
3
apaneloftotalamountofruralcreditatthemunicipalitylevel. Wealsocollectmunic-
ipality level data on satellite-based deforestation from the National Institute for Space
Research’s (Instituto Nacional de Pesquisas Espaciais, INPE) Project for Monitoring
Deforestation in the Legal Amazon (Projeto de Monitoramento do Desflorestamento na
Amazônia Le gal, PRODES/INPE).
Our main difference-in-differences results indicate that Resolution 3,545 led to a reduc-
tion in the concessio n of rural credit in the Amazon Biome. In counterfactual simulations,
we estimate that approximately BRL 2.9 billion (USD 1.4 billion) were not loaned in the
2008 through 2011 period due to restrictions imposed by Resolution 3,545. A reduc-
tion in loans specific to cattle ranching activities accounted for 90% of this effect. The
resolution also led to a decrease in the concession of non-Pronaf credit, as compared to
Pronaf credit, within a given municipality. This is to be expected in light of the legal
exemptions that were introduced for small-scale producers. Counterfactual simulations
conducted using the Pronaf vs non-Pronaf specifications yield results similar to those
obtained using the biome vs non-biome specifications, which is reassuring in terms of
support for our identification strategy. Several robustness checks corroborate the use of
our main specifications.
We investigate p otential heterogeneous effects of Resolution 3,545 by exploring specific
elements of municipality and contract-level heterogeneity. First, we test if the policy’s
impact differed among municipalities with different leading economic activities. Munici-
palities are categorized as being either cattle or crop-oriented. Our findings suggest that
the resolution had a signifi cant negative impact on rural credit concession in both types
of municipalities, with a stronger effect on cattle-oriented ones.
Second, we analyze how Resolution 3,545 affected the size and the composition of
rural credit contracts in the Amazon Biome. Results show that the policy had a distribu-
tional effect on ca ttle-specific contracts. The number of medium and large cattle-specific
contracts, as well as the number of medium crop-specific contracts decreased, while the
number of small cattle-specific contracts slightly increased. W e document no impact on
small crop-specific contra cts. This effect is likely the consequence of credit agents striving
to reallocate resources away from credit takers subject to the resolutio n’s conditions and
towards those facing less stringent legal restrictions.
Having shown that Resolution 3,545 caused a reduction in rural credit concession in
the Amazon Biome, we move on to test whether this reduction affected deforestation.
Results from instrumental variable regressions indicate that the decrease in rural credit
helped contain deforestation in the biome. In counterfactual simulations, we estimate that
over 2,700 square kilometers of forest would have been cleared from 2009 through 2011
in the absence of the resolution-induced credit constraint. Considering that deforestation
rates in the late 2000s and early 2010s were between 5,00 0 and 7, 00 0 square kilo meters
4
per year, the effect attributed to the resolution is quite substantial. We also find that
the relationship between rural credit and deforestation varies according to the regionally
leading economic activity, with municipalities where cattle ranching predominates over
crop farming showing a stronger impact of credit on deforestation. Overall, the results
suggest that there are relevant credit constraints affecting the deforestation activity in the
Brazilian Amazon Biome, and that the expansion of agriculture at the extensive margin
in the biome - particularly in cattle-oriented municipalities - is financially constrained.
Again, we run several robustness checks that corroborate our results.
The remainder of the paper is structured as follows. Next section presents a short
literature review. Section 2 presents an overview of related literature. Section 3 describes
the institutional co ntext of rural credit and Resolution 3,545 at the time of policy im-
plementation. Section 4 introduces the model that guides our empirical analysis and
defines the role of credit constraints within our framework. Section 5 describes the data
and presents stylized facts and trends on credit concession and deforestation. Section 6
details the empirical strategy used to calculate the impact of Resolution 3,545 on credit
and deforestation. Section 7 discusses results on policy effectiveness in restricting credit.
Section 8 discusses results on the relationship between credit and deforestation. Section
9 clo ses with final remarks.
2. Related literature
The literature analyzing the direct link between credit and deforestation is scarce.
Binswanger (1991) discusses whether there exists a positive relationship between credit
and deforestation. He argues that subsidized rural credit tends to increase the demand
for land, leading to a more rapid expansion of crop farmland and pasture, but does not
formally test his hypotheses. Yet, rural credit policies could also encourage producers
to increase productivity within a given area of land. Pfaff (1999) empirically studies the
relationship between a proxy for credit supply and deforestation in the Brazilian Amazon.
He finds that the number of bank branches is positively correlated with deforestation,
thought this result is not significant in all specifications. Hargrave and Kis-Katos (2010)
also find positive correlation between credit and deforestation in some regressions, and no
such impact in others (including their preferred specification). Unlike previous studies,
we explore a policy-induced and exogeno us source of variation in rural credit. By using
the policy change as an instrumental variable for credit supply, we are able to identify a
causal relationship between credit and deforestation. We find a positive and robust effect
of rural credit on deforestation.
Our results also provide a better understanding of the determinants of the recent
Brazilian Amazon deforestatio n slowdown. After peaking at over 27,000 square kilome-
ters per year in 2004, the deforestation rate in the Brazilian Legal Amazon decreased
5
substantially in the second half of the 2000s to about 5,000 square kilometers in 2011
(INPE (2012)). The Amazon forest is the planet’s largest rainforest tract, as well as the
world’s most active agricultural frontier in terms of forest loss and CO
2
emissions (FAO
(2006), Morton et al. (2 0 0 6 ), Santilli et al. (2005)).
There is a substantial stream of literature documenting the impact of long-run so-
cioeconomic drivers of deforestation activity in the Amazon (for instance, previous works
investigate the effect of population, road density, and agroclimatic characteristics on de-
forestation in the Amazon - see Chomitz and Thomas (2003), Reis and Guzmán (1994),
Reis and Margulis (1991)). However, there is scarce empirical evidence on the imme-
diate drivers of the recent and sharp deforestation slowdown in the region. This paper
complements the findings of Assunção et al. (2011). The authors show that, even when
controlling for commodity prices and relevant fixed effects, conservation policies intro-
duced starting in 2004 and 2008 helped avoid half of the forest clearings that would have
been observed from 2002 through 2009 should the policies not have been adopted. Our
paper isolates the credit channel and specifically tests whether credit constra ints have
been effective in curbing deforestation vis-a-vis other recent conservation efforts adopted
in the Brazilian Amazon.
Finally, our results contribute to a broader literature on rural credit. Previous studies
have found beneficial effects of the availability of credit in rural contexts. Credit sup-
ply ha s been positively associated with poverty reduction (Burgess and Pande (2005)),
agricultural investment and consumption smoothing (Rosenzweig and Wolpin (1993),
Conning and Udry (2007)). In this paper we unfold a potential negative externality by
documenting that the ava ila bility of rural credit may also lead to higher deforestation.
3. Institutional Context
Rural credit is one of Brazil’s most traditional ways to support agriculture (MAPA
(2003)). It encompasses significant government subsidy. The Ministry of Agriculture
(Ministério da Agricultura, Pecuária e Abastecimento , MAPA) estimates that approxi-
mately 30% of the resources needed in a typical harvest year a re funded by rural credit
(MAPA (2003)). The remaining 70% come from producers’ own resources, as well as
from other agents of agribusiness (such as trading companies) and other market mech-
anisms (such as legal instruments that enable the pre-sale of production). In light of
this, any policy measure that affects rural credit also affects one of Brazil’s main support
mechanisms for agricultural production.
In Brazil, rural credit is loaned according to rules and conditions established in the
Central Bank’s Manual of Rural Credit (Manual de Crédito Rural, MCR). It is used to
finance short-term operating funds, investment, and commercialization o f rural produc-
6

tion.
1
All agents comprising the National System of Rural Credit (Sistema Nacional
de Crédito Rural, SNCR), which encompasses public banks, private banks, and credit
cooperatives, must abide by the MCR’s norms.
One of the key policy instruments for determining the concession of rural credit in
Brazil is the annual Crop and Livestock Plan (Plano Agrícola e Pecuário, PAP), com-
monly known as the Harvest Plan (Plano Safra). Published in the first semester of each
year by the MAPA, the PAP summarizes the directives established for agricultural policy
in each harvest year.
2
The document is intended to serve as guidance for producers,
informing them about elements central to agricultural production in the country. At the
PAP’s core are the government’s plans regarding amounts of credit to be loaned to b o th
commercial and family production
3
,aswellasthesubsidizedinterestratesthatapplyto
alargefractionofplannedcreditloans.
From a total of BRL 14.7 billion (USD 7.3 billion) in the 2001/2002 harvest year, the
amount of credit planned for rural commercial production in the PAP increased to BRL
50.0 billion (USD 24.7 billion) in 2006/2007 and reached BRL 102.7 billion (USD 50.7
billion) in 2011/2012. A large share - typica lly over half - of these resources were loaned
under fixed per year interest rates: 8.75% up to and throug hout the 2006/2007 harvest
year, and 6.75% thereafter (see MAPA (2001), MAPA (2006), and MAPA (2011)).
Considering the annua l SELIC
4
rate of over 18% in the beginning of the 2000s and over
8% in the beginning of the 2010s, the interest rates established in the PAP represented a
very significant government subsidy for rural credit. Family production, whose planned
amount of credit increased from BRL 2.5 billion (USD 1.2 billion) in the 2001/2002 PAP
to BRL 10.0 and 16.0 billion (USD 4.9 and 7.9 billion) in the 2006/2007 and 201 1 /2012
PAPs respectively, received even greater subsidies, having access to annual interest rates
as low as 1% for specific categories of production.
3.1. Conservation Policy Efforts and Central Bank Resolution 3,545
Brazilian conservation policies underwent profound revision in the 2000s. Most of
these changes occurred within the framework of the Action Plan for the Prevention and
1
According to MAP A’s classification system, short-term operating funds credit is meant to cover the
usual expenses of production cycles; investment credit is to be applied to durable goods or services
whose benefits last over an extended period of time; and commercialization credit is intended f or use
in ensuring supply and allowing for storage during periods of falling agricultural output prices. As, in
practice, some activities may fall into multiple categories, we restrict our attention to aggregate credit.
2
In Brazil, a harvest year is the period covering July of a current year through June of the following
year.
3
A family producer is described in Law 11,326/2006 as one who practices rural activities while simultane-
ously meeting the following criteria: (i) holds no more than four fiscal modules, where a fiscal module is
defined as the minimum area needed in each municipality to ensure the economic viability of exploring
a rural establishment within that municipality; (ii) uses predominantly own family’s labor in establish-
ment’s economic activities; (iii) meets a minimum of family income originating from establishment’s
economic activities; and (iv) manages establishment alongside own family.
4
The SELIC rate is the Brazilian Central Bank’s overnight rate.
7
Control of Deforestation in the Legal Amazon (Plano de Ação para a Prevenção e o
Controle do Desmatamento na Amazônia Legal, PPCDAm). Launched in 2004, this plan
inaugurated a new form of dealing with deforestation. It integrated action across different
government institutions, and introduced innovative procedures for monitoring, environ-
mental control, and territoria l management in the Legal Amazon (Ipea et al. (2011),
IPAM (2009)). Henceforth, policymakers sought to inhibit forest clearings and promote
forest conservation through three main policy efforts: the strengthening of command and
control operations, the expansion of protected territory, and the adoption of more restric-
tive rural credit policies. The remainder of this section focuses on Resolution 3,54 5 , the
major rural credit policy change of the end of the 2000s.
Published by the CMN on February 29
th
,2008,Resolution3,545conditionedthe
concession of rural credit for use in agricultural activities in the Amazon Biome upon
presentation of proof of borrowers’ compliance with environmental legislation, as well as
of the legitimacy of their land claims and the regularity of their rural establishments. The
measure, aimed at restricting credit for those who infringed environmental regulations,
applied to all establishments in municipalities located entirely within the Amazon Biome.
Resolution 3,583, published on July 1
st
,2008,determinedthatinfrontiermunicipalities,
whose territory is only partially located within the biome, the conditions a pplied solely
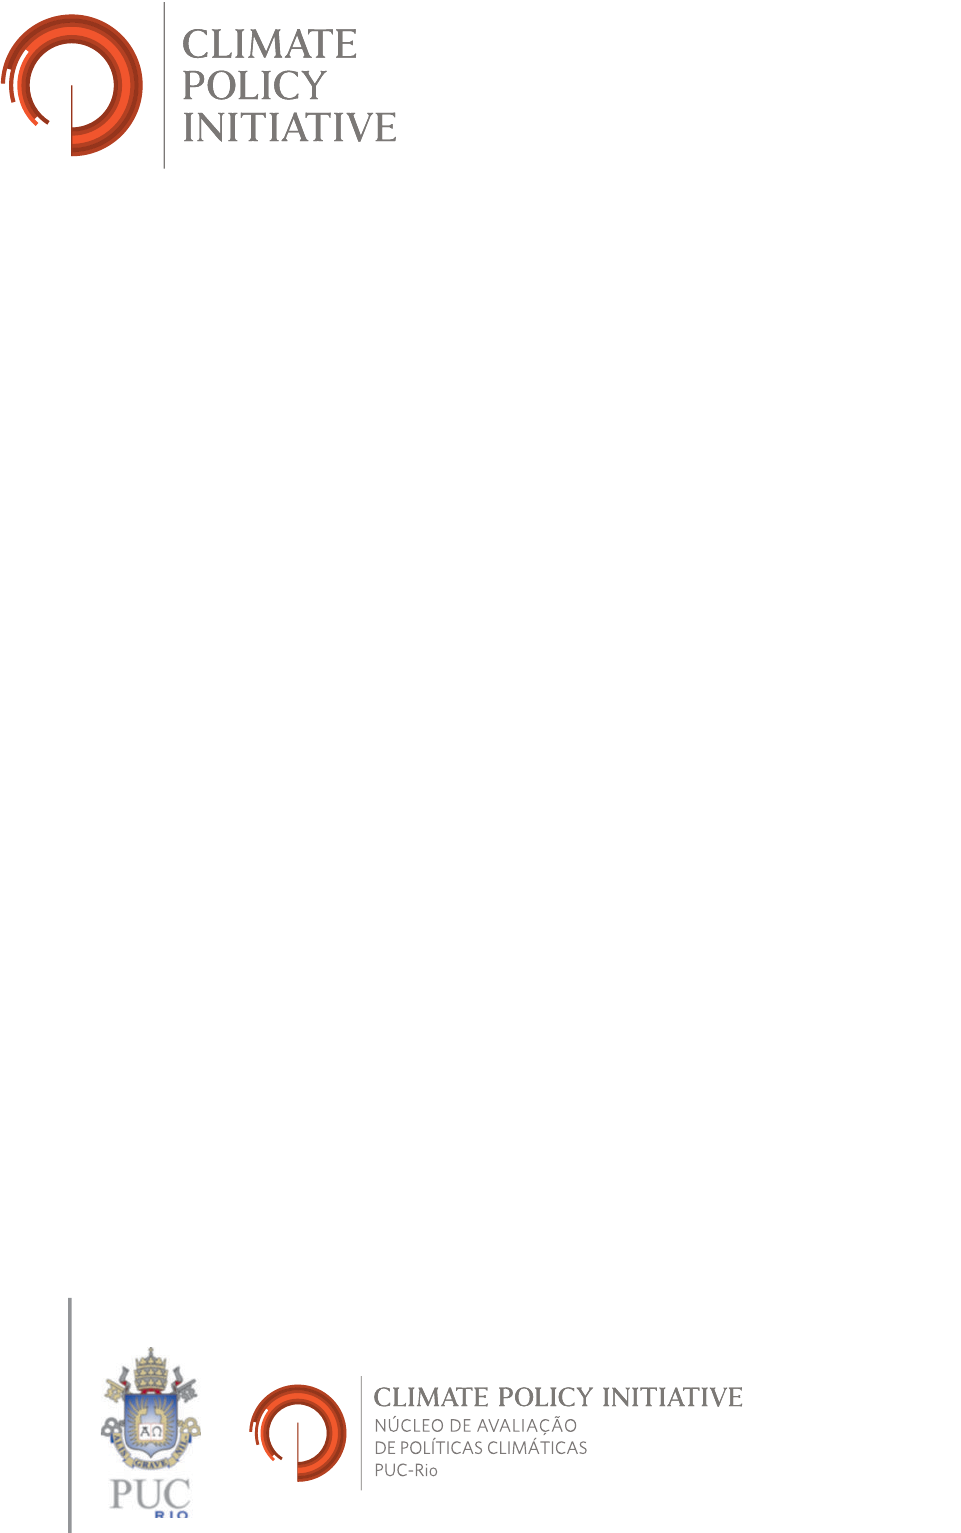
to establishments located entirely or partially inside the biome. As the Amazon Biome
is contained within the Legal Amazon, all biome municipalities are necessarily located
in the Legal Amazon, but not all Legal Amazon municipalities are part of the Amazon
Biome (see Figure 1).
As all related institutions - public banks, private banks, and credit cooperatives - were
obligated to abide by the new rules, the resolution represented a potential restriction on
official rural credit, and thereby on the fraction of it that is largely subsidized via lower
interest rates. However, other sources of fina ncing for agricultural activity, such as traders
and supplier’s credit, suffered no such restriction.
As determined in Resolution 3,545, to prove eligibility for taking credit, the borrower
had to present: (i) the Certificate of Registry of the Rural Establishment (Certificado
de Cadastro de Imóvel Rural, CCIR); (ii) a declaration stating the absence of current
embargoes caused by economic use of illegally deforested areas; and (iii) a state-issued
document attesting the environmental reg ula rity of the establishment hosting the project
to be financed, or, in the absence of such document, a state-issued certificate indicating
that the documentation necessary for regularization had been received. The resolution’s
requirements applied not only to landowners, but also to associates, sharecroppers and
tenants. Implementation of Resolution 3,545 terms by all credit agents was optiona l as
of May 1
st
,2008,andobligatoryasofJuly1
st
,2008.
Although seemingly restrictive at first, the conditioning mea sures of Resolution 3,545
8

were subject to a series of qualifications that loosened the severity of the new credit
constraints. This was pa rticula rly relevant for small-scale producers. In its original text,
Resolution 3,545 already established exemptions for three groups of small credit takers.
The first group, composed of Pronaf beneficiaries and rural producers operating in areas
smaller than or equal to four fiscal modules
5
, was still required to present the CCIR, but
could replace the rest of the documentation by an individual declaration attesting the
existence of the required legal reserve and area of permanent protection, and the absence
of current embargoes caused by the economic use of illegally deforested areas within the
credit taker’s establishment.
The second group, encompassing beneficiaries of the National Program of Land Re-
form (Programa Nacional de Reforma Agrária, PNRA) who fit into Pronaf groups A
6
and A/C
7
,couldreplacealldocumentationbyadeclarationissuedbytheNationalIn-
stitute of Colonization and Land Reform (Instituto Nacional de Colonização e Reforma
Agrária,Incra)eitherattestingthelandreformsettlement’senvironmentalregularity,or
indicating that a term on the regularizatio n of the settlement had been agreed upon. An
annex with a list of all land reform settlement beneficiaries had to be included in the
documentation.
The third group, restricted to family producers fitting into Pronaf group B
8
,was
not required to present any documentation. As the three groups referred to small-scale
producers, these exemptions implied that Resolution 3,545 established less restrictive
conditions for small producers.
Soon after the compulsory adoption of the resolution, new CMN measures further
loosened the requirements for the co ncessio n of rural credit to small producers. With the
passing of Resolution 3,599 on August 2 9
th
,2008,borrowersfromthefirstgroupcould
5
The actual size of a fiscal module varies according to municipality. It depends mainly on the conditions of
pro duction in each municipality including, but not limited to, market dynamics, installed infrastructure,
technologic al availability, and natural features such as soil quality and water availability.
6
Pronaf Group A refers to family producers settled into PNRA land reform settlements, as well as
to beneficiaries of the National Program of Land Credit (Programa Nacional de Crédito Fundiário,
PNCF) who have not yet taken investment credit under the Program of Special Credit for Land Reform
(Programa de Crédito Especial para a Reforma Agrária,Procera)orthathavenotyetreachedthe
maximum credit limit for structural investment within Pronaf. The group also includes family producers
who were relocated due to the construction of dams for use in hydroelectric power generation or for the
provision of water to land reform settlements.
7
Pronaf Group A/C refers to family producers settled into PNRA land reform settlements, as well as to
beneficiaries of the PNCF who not only possess the Group A/C Declaration of Eligibility for Pronaf
(Declaração de Aptidão ao Programa, DAP), but who have also already contracted a first op eration in
Group A, and have not obtained financing for working capital in a Pronaf group other than A/C.
8
Pronaf Group B refers to family producers that meet all of following criteria: (i) explore a fraction of
land as owner, land reform settler, tenant or associate; (ii) live in or near the property; (iii) have access
to an area no greater than four fiscal modules; (iv) derive at least 30% of family income from both the
agricultural and non-agricultural exploration of the property; (v) base exploration of the prop erty on
family labor; and (vi) have total family income of up to BRL 6,000 (USD 2,962.20), excluding social
benefits. This group is known as Pronaf’s rural microcredit group.
9

present a declaration attesting not the existence, but the recomposition or regeneration of
the required legal reserve and area of permanent protection within their establishments.
Similarly, instead of attesting the land refo rm settlement’s environmental regularity, the
Incra declaration presented by borrowers from the second group could attest that the land
reform settlement had an environmental license or that the process for obtaining such
license had already been started. Resolution 3,599 and Resolution 3,61 8 from September
30
th
, 2008, also included the fo llowing in the list of Pronaf beneficiaries exempted from
presenting any documentation: indigenous people, quilombolas,
9
,small-scalefishermen,
inhabitants or users of conservation units of sustainable use, and reg ula r inhabitants of
river margins.
Small producers also benefitted from several exceptions introduced for specific harvest
years. The CMN determined that the CCIR could be substituted either by the DA P (a
document held strictly by eligible Pronaf beneficiaries) for program beneficiaries, or by a
CCIR request for all other rural producers operating in areas no greater than four fiscal
modules. Resolution 3,618 introduced this new rule for the 2008/2009 harvest year, and
Resolution 3,735, published on June 17
th
,2009,extendedittothe2009/2010harvest
year.
From an institutional perspective, Resolution 3,545 established the same restrictions
and exceptions in all municipalities to which it applied and, thus, represented a homoge-
neous policy change across regions. Even so, its impact on rural credit concession and,
consequently, on deforestation may have differed across economic sectors due to struc-
tural heterogeneity. A key structural difference we take into account is the composition
of sources used to meet financial requirements for crop and cattle production. According
to FAO (2007), the relative participation of official rural credit contracts has decreased,
as agricultural financing, particularly for soybean production, has increasingly been ob-
tained through contracts with traders, input and processing industries, and retailers and
market operators. Government credit meets an estimated 30% of the financial require-
ments of the soybean production sector in Brazil, but the remaining funds are provided
by traders and the processing industry (40%), the input industry (15%), and farmers’
own resources (10%), with the remaining 5% being attributed to other sources, such as
manufacturers of agricultural machinery (FAO (2007)). A crop farming sector that is not
heavily dependent on official rural credit, as appears to be the case in Brazil, could com-
pensate the decrease in official rural credit imposed by Resolution 3,545 with alternative
sources of financing. Producers operating in this sector would thus be able to sustain
investment and deforesta tio n at the same levels as before the credit policy intervention.
Crop production in Brazil also experienced relevant technological advances starting in
the early 1990s, particularly with the widespread adoption of direct seeding (FAO (2007)).
9
Quilombolas are inhabitants of quilombos settlements traditionally founded by escaped slaves.
10
No such pattern was observed for livestock farming, which remains a low-produ ctivity
practice in the country. Cro p fa rmers likely invest a larger share of rural credit loans
in the intensification of production, instead of expanding production by operating in the
extensive margin as cattle ranchers do. In this case, a decrease in rural credit for crop
farmers might not lead to a decrease in forest clearings, since resources were not originally
being used to push agricultural production into forest areas. We examine these potential
sectoral differences.
Resolution 3,545 was originally proposed as a means to restrict credit to those who did
not abide by environmental regulations in the Amazon Biome. However, the resolution
was flexible for small producers already a t its outset, and became increasingly so in a
relatively short period of time. Additionally, altho ugh the resolution constituted an insti-
tutional change at the federal level, regional heterogeneities may have influenced the way
in which the resolution impacted local access to credit and, thus, affected deforestation.
It is therefore likely that Resolution 3,545’s effects differed among different segments of
producers and regions. We explore this idea in the empirical analysis described in the
remainder o f this paper.
4. Model
This section presents the theoretical model that guides our empirical analysis. The
model, inspired by Banerjee and Duflo (2012), focuses on how credit constraints can influ-
ence deforestation when different production technologies are available to the producer.
Suppose a farmer operates in a forest a rea and chooses one among two agricultural
production technologies - traditional or modern. With the traditional technology, the
farmer produces agricultural output using labor and land inputs. This traditional tech-
nology is described by:
f(L, T ) (1)
where L is labor employed and T is area used for production. With the modern technol-
ogy, in addition to labor and land, the farmer also uses other inputs, K,suchastractors
and fertilizers. This modern technology is described by:
F (K, L, T )=A(K)f(L, T ) (2)
Assume that labor can be paid at the end of the harvest period, but that expenditures
with non-labor inputs must be paid in advance. Taking M as total working capital
av ailable to the farmer, working capital constraints are given by p
T
T ≤ M and p
K
K +
p
T
T ≤ M for the traditional and modern technologies, respectively. These constraints
allow for the possibility of existing binding credit financing as in Feder (1985) and Udry
(2010). A farmer using the traditional technology therefore faces the following decision
11

problem:
π
traditional
(M)=max
L,T
f(L, T ) − p
L
L − p
T
T (3)
subject to p
T
T ≤ M
Similarly, the decision problem for a farmer using the modern technolo gy can be described
as:
π
modern
(M)=max
K,L,T
A(K)f (L, T ) − p
K
K − p
L
L − p
T
T (4)
subject to p
K
K + p
T
T ≤ M
Thus, a farmer with available working capital M chooses the modern technology if, and
only if, π
modern
(M) ≥ π
traditional
(M).DefineM
0
such that π
modern
(M
0
)=π
traditional
(M
0
).
We assume that p
k
and A(K) are such that all farmers with M ≥ M
0
choose the modern
technology. In summary:
π (M)=
π
traditional
(M)ifM<M
0
π
modern
(M)ifM ≥ M
0
(5)
Within this framework, with the farmer operating in a forest area, the choice of area
to be used for productio n is equivalent to deforestation. We are therefore pa rticul arly
interested in how optimal farmland size is affected by the availability of capital when the
farmer is allowed a choice of production technology.
To simplify the analysis, we consider specific functional fo rms for the production
functions, assuming that f (L, T )=L
β
T
γ
and A(K)=K
α
, where α > 0, β > 0, γ > 0
and α + β + γ < 1. The assumption of decreasing returns to scale helps determine a finite
optimal farmland size. We focus on the characterization of the optimal land input. For
the traditio na l technology, the optimal choice of farmland is given by:
T
traditional
(M)=
M
p
T
, ifM<M
T
∗
traditional
ifM ≥ M
(6)
(7)
where T
∗
traditional
≡
γ
p
T
1−β
1−β−γ
β
p
L
β
1−β−γ
and M = p
T
T
∗
traditional
.Forthemoderntech-
nology, the optimal choice of farmland is given by:
T
modern
(M)=
γ
α + γ
M
p
T
ifM<M
T
∗
modern
ifM ≥ M
(8)
12

where T
∗
modern
≡
α
p
K
α
1−α−β−γ
β
p
L
β
1−α−β−γ
γ
p
T
1−α−β
1−α−β−γ
and M = p
K
K
∗
modern
+p
T
T
∗
modern
.
The relative values of M
0
,
M and M define different possible cases. For example, a
configuration such that M
0
< M<M implies in the optimal farmland size graph shown
in Figure 2.
Define M
∗
as the farm’s total investment if the farmer can borrow as much as he
wants at the interest rate r. Thus,
M
∗
(r)=argmax
M
Π(M) − (1 + r)M (9)
represents the first-best investment level.
We assume that a typical farmer can be financed by two different sources and ignore,
for the sake of simplicity, the possibility of self-financing. A subsidized rural credit line
is available at cost r
b
, which is b elow the market interest rate r
m
, r
b
<r
m
.Denotingthe
amounts of subsidized rural credit and market credit as M
b
and M
m
,respectively,total
investment is given by M = M
b
+ M
m
. Following Banerjee and Duflo (2012), we say
that a farmer is credit rationed at the subsidized interest rate if M
b
<M
∗
(r
b
),andthat
afarmeriscredit constrained if M<M
∗
(r
m
).
As argued in Section 3, Resolution 3 ,5 45 may have reduced the availability of sub-
sidized rural credit for some farmers in the Amazon Biome. Yet, the supply of credit
supplied at the market rate by agents other than official banks (private and public) and
credit cooperatives was not directly affected by the resolution. Our theoretical model
offers intuition on how farmers are expected to react to this change in the supply of
credit, and thereby potentially affect deforestation, under different assumptions about
the availability of financial reso u rces.
To restrict the ana lysis to a simple, yet interesting, situation, consider the case de-
picted in Figure 2, where M
0
< M<M .Otherconfigurationscanbeconsideredanal-
ogously. Start with the region where total investment lies below M .Increasesinthe
availability of resources within each technology region - (0,M
0
) or (M
0
, M) -affect land
size positively. There being no change in the choice of production technology, a reduction
in credit leads to a decrease in optimal farmland size a nd thereby reduces deforestation.
However, changes in the availa bility of resources that cause farmers to switch between
technology regions - from (0,M
0
) to (M
0
, M) or vice-versa - have an ambiguous effect on
land size. A reduction in credit may lead the farmer to substitute the modern technology
for the traditional one, potentially leading to an increase in optimal farmland size and
deforestation. In the region where total investment lies above M ,farmersarenotcredit
constrained, so changes within this region do not affect o ptimal farmland size. Thus, a
reduction in M
b
that keeps the farmer in the unconstrained region does not affect defor-
13

estation, but a reduction in the availability of resources that pushes that farmer into the
(M
0
, M) interva l will reduce optimal farmland size and deforestation. An even stronger
reduction in the availability of resources that further pushes the farmer into the (0,M
0
)
interval has an ambiguous impact on deforestation. Propositions 1-3 summarize these
results in the context of the credit reduction implied by Resolution 3,545.
Proposition 1: If the reduction in the availability of subsidized rural credit causes a
reduction in deforestation, we can conclude that: (i) farmers are credit constrained; and
(ii) credit and deforestation have a positive relationship in the region.
Proposition 2: If the reduction in the availability of subsidized rural credit does
not affect the amount of cleared land, we can conclude that: (i) either farmers are not
credit constrained (they could simply be substituting subsidized rural credit by market
credit); or (ii) farmers are credit constrained, but are changing from the modern to the
traditional technology.
Proposition 3: If the reduction in the availability of subsidized rural credit implies
an increase in deforestation, we can conclude that: (i) farmers are credit constrained; and
(ii) they are changing from the modern to the traditional technology.
In summary, a subsidized credit policy restriction can: (i) serve as evidence of credit
constraints if we observe an impact on deforestation; and (ii) reveal whether the rele-
vant margin is change in optimal farmland size within a given technology (decreasing
deforestation) or change across production technologies (increasing deforestation).
5. Data, Descriptive Statistics and Stylized Facts
This section introduces the data used in our empirical evaluation of Resolution 3,545,
presents descriptive statistics and discusses stylized facts to characterize aggregate trends
for our variables of interest.
5.1. Data on Rural Credit
Our analysis is based on two panels of municipality-level data covering the 2002
through 2011 period. The first panel is constructed from a contract-level microdata
set of rural credit loan contracts compiled by the Central Bank from Recor data. This
is an administrative microdata set enco mpa ssin g all rural contract records negotiated by
official banks - both public and private - and credit cooperatives in the Legal Amazon
states of Acre, Amazonas, Amapá, Maranhão, Mato Grosso, Pará, Rondônia, Roraima
and Tocantins.
10
It contains detailed information about each contract, such as the exact
day on which it was signed, its value in BRL, the contracted interest rate and maturation
date, its intended use by agricultural activity, and the category under which credit was
10
Only a fraction of the state of Maranhão is considered part of the Le gal Amazon. Our sample only
includes mu n ic ipalities from this fraction.
14

loaned (short-term operating funds, investment, or commercialization). The data set also
contains information about the official source of funding for each contract, allowing us to
identify whether lo a ns fit into Pronaf or non-Pronaf credit lines. All contracts are linked
to a code identifying the municipality in which the borrower’s landholding is located. We
add up the value of the contract loans across all days in each month and each municipality
to co nvert the microdata panel into a municipality-by-month panel.
Since Resolution 3,545 conditions applied to all esta blishments in municipalities lo-
cated entirely within the Amazon Biome, we merge our panel of municipality-by-month
credit loans data with a geocoded map containing information on the biome’s geographic
limits and municipalities’ location. We then identify, for each sample municipality,
whether it is entirely located inside the Amazon Biome. We also construct variables
indicating the shortest lin ear distance, in kilometers, between each municipality’s border
and the biome frontier. Using this variable, we can create subsamples of municipalities,
both inside and outside the Amazon Biome, located within sp ecific distances to the biome
frontier.
To smoothen the large cross-sectional variation in values of credit contracts generated
by different municipality sizes, we use a normalized measure of rural credit. This nor-
malization ensures that our analysis captures relative variations in credit lending within
municipalities. The variable is constructed according to the following expression:
Credit
it
=
C
it
− C
it
sd (C
it
)
(10)
where Credit
it
is the normalized amo unt of rural credit loaned in municipality i and
month-year t;thetermC
it
is the amount of rural credit loaned in municipality i and
month-year t in BRL; and the terms C
it
and sd (C
it
) are, respectively, the mean and the
standard deviation of the amount of rural credit loaned in municipality i over the 2002
through 2011 period. The variable C
it
replaces Credit
it
in robustness checks.
The final data set containing information on rural credit, time, and geographic vari-
ables at the municipality-by-month level is used to evaluate the impact of Resolution
3,545 on rural credit loans. Our sample does not include municipalities crossed by the
biome frontier, since only those farmers whose landholdings are entirely located within
the biome in these municipalities are subject to the resolution’s conditions. The full sam-
ple is composed by 713 Legal Amazon municipalities, of which 458 are located inside the
Amazon Biome and 255 outside it. We use our constructed distance variable to create
a restricted subsample that o nly includes municipalities located within 100 kilometers of
the biome frontier. This subsample has 387 municipalities, of which 132 are inside the
Amazon Biome and 255 outside it. We construct a second restricted subsample composed
by municipalities where the pre-2 0 0 8 average value of annual credit loans for cattle ranch-
15

ing was higher than that for crop production. This "cattle-oriented" subsample co ntains
301 municipalities located inside the Amazon Biome and 154 outside it. Finally, we con-
struct an analogous restricted subsample of municipalities where the pre-2008 average
value of annual credit loans for crop production was higher than that for cattle ranching.
This "crop-oriented" subsample contains 133 located inside the Amazon Biome and 101
outside it.
5.2. Data on Deforestation
The second panel of data relates rura l credit loans to deforestation at the municipality
level. Data on deforestation is built from satellite-based images that are processed at the
municipality level and publicly released by PRODES/INPE. Because PRODES data is
reported annually, we must first convert our municipality-by-month credit panel into a
municipality-by-year credit panel. We define deforestation as the annual deforestation
increment, that is, the area in square kilometers of forest cleared over the twelve months
leading up to August of a given year.
11
We recode credit loans accordingly, summing up
monthly data into an annual basis, where year t data sums information over the twelve
months leading up to August of t.
For any given municipality, cloud cover during the perio d of remote sensing may
compromise the accuracy of satellite images, requiring images to be produced at a different
time. As a result, image records for different years may span from less to more than twelve
months. To control for measurement error, variables indicating unobservable areas are
included in all regressions. This data is also publicly available at the municipality-by-year
level from PRODES/INPE.
To smoo then the cross-sectional variation in deforestation that arises from municipal-
ity size heterogeneity, we use a normalized measure of the annual deforestation increment.
The normalization ensures that our analysis considers relative variations in deforestation
increments within municipalities. The variable is constructed according to the following
expression:
Deforest
it
=
ADI
it
− ADI
it
sd (ADI
it
)
(11)
where Def or e st
it
is the normalized annual deforestation increment for municipality i and
year t; ADI
it
is the annual deforestation increment measured in municipality i between
the 1
st
of August of t − 1 and the 31
st
of July of t;andADI
it
and sd (ADI
it
) are,
respectively, the mean and the standard deviation of the annual deforestation increment
calculated for each i over the 2002 through 2011 period. The variable ADI
it
replaces
Deforest
it
in robustness checks. Our sample does not include municipalities that showed
11
More precisely, the annual deforestation increment of year t measures the area in square kilometers
deforested between the 1
st
of August of t − 1 and the 31
st
of July of t.
16
no variation in deforestation throughout the sample yea rs, as this variation is needed to
calculate the normalized variable.
The final data set containing information on deforestation, rural credit, time, and
geographic variables at the municipality-by-year level is used to estimate the effects of
the credit restriction on deforestation. Aga in, we do not include municipalities crossed
by the biome frontier. The full sample comprises 575 Legal Amazon municipalities, of
which 439 are located inside the Amazon Biome and 136 outside it. We also construct the
three restricted subsamples introduced in Section 5.1. Their composition is as follows:
251 municipalities within 10 0 kilometers of the Amazon Biome frontier (115 inside the
biome and 136 outside it); 406 cattle-oriented municipalities (301 inside the biome and
105 outside it); and 141 crop-oriented municipalities (110 inside the biome and 31 outside
it).
5.3. Agricultural Output Prices and the Demand for Credit
Agricultural prices a re endogenous to local agricultural production. Thus, to control
for fluctuations in the demand for rural credit at the municipality level, we must construct
output price series that capture exogenous variations in the demand for agricultural com-
modities produced locally. As argued in Assunção et al. (2011), agricultural commodity
prices recorded in the southern Brazilian state of Paraná are highly correlated with av-
erage local crop prices calculated for the Legal Amazon sample municipalities. Hence,
we use the Paraná agricultura l commodity price series as exogenous indicators of lo ca l
market conditions within our empirical context. Prices for beef cattle, soybean, cassava ,
rice, corn, and sugarcane were collected at the Agriculture and Supply Secretariat of the
State of Paranáą (Secretaria de Agricultura e do Abastecimento do Estado do Paraná,
SEAB-PR). Soybean, cassava, rice, and corn are predominant crops in the Legal Amazon
in terms of harvested area. Although not a predominant crop in the region, sugarcane is
also included to take into consideration the recent expansion of Brazilian ethanol biofuel
production. Together, the five crops account for approximately 70% of total harvested
area averaged across sample years.
The Paraná price series are used to build two variables of interest. The first of these
variables, an annual index of crop prices, is constructed in three steps. First, we calculate
nominal monthly price series for each calendar year-month and culture. Annual prices
are defla ted to year 2011 BRL and are expressed as an index with base year 2011.
Second, we calculate a weighted real price for each of the crops according to the
following expression:
PPA
itc
= PP
tc
∗ A
ic,2000−2001
(12)
where PPA
itc
is the weighted real price o f crop c in municipality i and year t; PP
tc
is the
Paraná-based real price of crop c in year t expressed as an index with base year 2000; and
17

A
ic,2000−2001
is the share of municipal area used as farmland for production of crop c in
municipality i averaged over the 2000 through 2001 period.
12
This latter term captures
the relative importance of crop c within municipality i’s agricultural production in the
years immediately preceding the sample periods. It thus serves as a municipality-specific
weight that introduces cross-sectional variation in the commodity price series.
Third, we use principal component analysis on the weighted real crop prices to derive
the annual index of crop prices. This technique allows the price variations tha t are
common to the five selected crops to be represented in one single measure. The resulting
index of crop prices captures the first principal component of the five weighted real
prices. As the index maximizes the price variance, it represents a more comprehensive
measure of the agricultural output price scenario for this analysis than the individual
prices themselves. Moreover, by using the index of crop prices, which absorbs b o th cross-
sectional and time-specific trends at the municipality level plausibly correlated with credit
demand, we overcome an important empirical limitation.
The second variable of interest is a n annual index of cattle prices, which is derived anal-
ogously to PPA
itc
.However,aslandpastureisnotobservable,inthiscaseA
ci,2000−2001
is the ratio of heads of cattle to municipal area in municipality i averaged over the 2000
through 2001 period.
5.4. Stylized Facts and Trends
This section presents stylized facts and trends for rural credit and deforestation over
the past ten years. In this set of descriptive results, the evolution of agg reg ate credit
is influenced by both economic conditions and changes in the regulatory and institu-
tional landscape. Tables and figures shown were built from the contract-level credit loan
microdata set and the deforestation data set.
Table 1 presents descriptive statistics for average annual amounts of rural credit and
deforestation at the municipality level. Figures for Amazon Biome municipalities before
and after the implementation of Resolution 3,545 are compared with those for Legal
Amazon municipalities outside the biome. The statistics point towards more accentuated
aggregate rural credit growth in the post-resolution period in Legal Amazon municipalities
located outside the Amazon Biome, where borrowers were not subject to the resolution’s
restrictions. Average Pronaf loans inside the biome also seem to have grown more than
non-Pronaf loans, as is to be exp ected in light of the exemptions introduced for small-scale
producers operating in the Amazon Biome. Average deforestation, which is significantly
12
Variables on annual municipality crop production (harvested area, quantum,orvalueincurrentprices)
are based on data originally from the Municipal Crop Survey of the Brazilian Institute for Geog-
raphy and Statistics (Pesquisa Agrícola Municipal do Instituto Brasileiro de Geografia e Estatística,
PAM/IBGE).
18
higher in Ama zo n Biome municipalities, dropped sharply both inside and outside the
biome.
Stylized facts also hint at potential effects of Resolution 3,545. In Figure 3, average
rural credit loan trends for Amazon Biome municipalities do not seem to follow those for
its unrestricted counterpart outside the biome in the post-2008 period. The difference
in growth rates appears in both cattle and crop-oriented samples, suggesting that the
resolution imposed a binding credit constraint for rural producers within the biome.
Yet, as the pattern of credit loan trends differ for cattle and crop-oriented samples, our
empirical analysis explores whether the resolution’s impact depends on economic activity
heterogeneity.
Acloserlookattheevolutionofruralcreditloansthroughout2008revealsthatthe
constraint seems to have been anticipated by credit takers. Figure 4 illustrates this
phenomenon. While credit concession in 2006 and 2007 concentrated in the second half
of each year, it followed a very different pattern in 2008, peaking in April and again
in June. The total amount of credit negotiated in 2008, however, is similar to that of
previous years. Considering that the adoption of the measures established in Resolution
3,545 was optional as of May 1
st
and compulsory as of July 1
st
,theunseasonablepeaks
in 20 0 8 likely reflect borrowers’ efforts to have early access to resources that would soon
be restricted. Consequently, an accentuated decrease in the concession of credit was not
observed in 2008 despite the restrictions imposed by Resolution 3,545. This behavio r is
more clea rly seen in the trends for cattle-specific contracts than for crop-specific ones,
perhaps due to the intrinsically seasonal component of crop production. Alternatively,
this could be because crop farmers were less vulnerable to the reduction in subsidized
rural credit. As they were able to access credit from other sources even after the resolution
had been adopted, they had less need to anticipate credit prior to the policy.
In addition to assessing the resolution’s impact on rural credit concession, we are
interested in understanding how it affected deforestation. Figure 5 portrays the evolution
of average municipality-level deforestation. Deforestation dropped significantly starting
in the mid-2000s in Lega l Amazon municipalities both inside and outside the Amazon
Biome. In the post-2008 period, however, trends for biome municipalities appear to
behave differently from those for non-biome municipalities - deforestation exhibits more
accentuated drops inside the biome immediately after the adoption of Resolution 3,545
both in the cattle and the crop-oriented subsamples. Although not yet conclusive, this
could be an indication both that deforestation is a credit-dependent activity and that
there are relevant credit constraints for forest clearing in the Amazon Biome.
The stylized facts discussed in this section provide a descriptive overview of how
Resolution 3,545 might have affected the evolution of rural credit and deforestation in
the Amazon Biome. However, these facts capture the effects of other influencing factors,
19
particularly those of eco no mic circumstances in the Amazon Biome during the period of
interest. To evaluate the impact of Resolution 3,545, we must isolate the effect of the
resolution from that of other determinants of rural credit.
6. Empirical Strategy
This section describes the empirical strategy used to identify the causal effect of rural
credit on deforestation. Since only equilibrium prices and quantities are observed in the
credit market, many of the identification concerns mentioned in the literature have been
related to reverse causality and omitted variables. Reverse causality might take place if
the expansion of agricultural activities beyond the farmer’s landholding is done at the ex-
pense of public areas of forest. In this case, deforestation and appropriation of public land
increase real estate and collateralized asset-based lending, thereby allowing the farmer to
overcome borrowing constraints. Omitted variables that are simultaneously associated
with credit and land use, such as regional growth and agricultural output prices, may
also trivially jeopardize identification. In this paper we limit identification problems by
exploring the different margins of a credit policy break that generated exogenous varia-
tions in credit supply, within and across municipalities of the Brazilian Amazon, in the
late 2 0 0 0 s.
Our strategy foll ows a two -sta g e procedure. First, we evaluate Resolution 3,545’s
impact on rural credit market quantities. Then, we use different margins of this policy
change to derive instrumental variables for rural credit, which help us identify a causal
effect of rural credit on deforestation in a two-stage least squares (2SLS) estimation.
6.1. First Stage: Impact on Rural Credit
We explore different dimensions of Resolution 3,545 to provide a general characteri-
zation of its impacts on rural credit. First, the resolution specifically established that the
conditions to credit concession applied to municipalities in the Amazon Biome only. This
generates an explicit geographic cleavage between two groups of municipalities within
the Legal Amazon. We refer to municipalities located entirely within the Amazon Biome
as the intervention group. Legal Amazon municipalities located outside the biome form
the control group. Although intervention and contro l groups may systematically differ in
terms of long-persistent geographical characteristics, both have been exposed to similar
economic fluctuations and political cycles. This is particularly consistent for municipal-
ities near the biome frontier. This specific geographic break in Resolution 3,545, nested
within our monthly data on municipalities, allows us to perform a difference-in-differences
estimation defined by the following equation:
Credit
it
= α
i
+ φ
t
+ β
1
(Biome
i
∗ Post2008
t
)+β
2
P rices
it
+ β
3
P riority
it
+ �
it
(13)
20
where Cred it
it
is the normalized amount of rural credit loaned in municipality i and time
t, which indexes a specific month throughout the period.
We estimate models for total municipality rural credit loans, as well as for cattle and
crop-specific loans separately. Our variable of interest is the interaction of a dummy indi-
cating whether the municipality is located within the Amazon Biome, Biome
i
, with a vari-
able that indicates the period after the implementation of Resolution 3,545, Post2008
t
,
which includes all years from 2008 o nwards. We consider all of 2008 as part of the post-
resolution p eriod to avoid finding a significant coefficient when, in fact, we are simply
capturing the anticipation effect (recall that credit concession in the biome was very low
in the first half of 2008 and very high in the second half).
The term α
i
includes municipality fixed effects, which absorb initial conditions and
persistent municipality characteristics, such as geography and transport infrastructure.
The term φ
t
includes month fixed effects, which also absorb year fixed effects by con-
struction. These variables control fo r common time trends, such as seasonal fluctuations
in agricultural activity, macro eco nomic conditions, common rural policies, and the po-
litical cycle. The term P rices
it
proxies for municipality-specific demand for credit, as it
includes annual cattle and crop price indices (current and lagged) varying over time at
the municipality level. Finally, the term P riority
it
indicates municipalities included in a
priority list of top deforesters, which have recently been the focus of conservation policy
efforts. The parameter of interest β
1
captures the causal effect of Resolution 3,545 on
rural credit if the residuals contain no omitted variables driving the correlation between
the policy and either the demand for and/or supply of credit loans.
We rely on another difference-in-differences strategy to explore a second dimension
of Resolution 3,545’s design. As explained in Section 3.1, Resolution 3,545 established
exemptions regarding requirements for small producers. Considering that Pronaf bene-
ficiaries are, by definition, small producers, and taking into account that the restrictive
conditions were eased specifically for credit loans contracted via Pronaf credit lines, the
comparison between Pronaf and non-Pronaf loans within municipalities, before and af-
ter the resolution, offers another source of exogenous variation in credit supply. The
specificities of the policy design therefore enable us to construct intervention and control
groups within municipalities located in the Amazon Biome. We take advantage of this
by estimating a triple-differences model that compares rural credit loans before and after
the implementation of Resolution 3,545, in municipalities located inside and outside the
biome, a nd between Pronaf and non-Pronaf groups within municipalities. This strategy,
based on an extension o f model (13), is defined by the following equation:
Credit
itk
= α
i
+ φ
t
+ β
1
Nonpronaf
it
+ β
2
(Nonpronaf
it
∗ Biome
i
)+
21
+β
3
(Nonpronaf
it
∗ Post2008
t
)+β
4
(Biome
i
∗ Post2008
t
)+ (14)
+β
5
(Nonpronaf
it
∗ Biome
i
∗ Post2008
t
)+β
6
P rices
it
+ β
7
P riority
it
+ �
itk
where Credit
itk
is now the amount of rural credit loaned in municipality i,attimet,and
of type k ∈ {Pronaf, non-Pronaf}. The term Nonpronaf
it
is a dummy assuming value 1
if (k = non-Pronaf) and 0 otherwise, which we interact with the dummies Post2008
t
and
Biome
i
. The parameter of interest β
5
is expected to capture the marginal variation in
non-Pronaf credit loans within the Amazon Biome after the implementation of Resolution
3,545.
We discuss some caveats associated with models (13) and (14) in robustness checks.
In all specifications, standard errors are robust to arbitrary forms of heteroscedasticity
and clustered at the municipality level to allow for correlation at a given time, and across
time within municipalities.
6.2. Second Stage: Impact on Deforestation
Using the municipality-by-year panel detailed in Section 5.2, we can therefore use
models (13) and (14) as first stage regressions in a 2SLS approach, which helps us identify
acausaleffect of rural credit on deforestation.
We begin by defining a second stage specification for which model (13) is the first
stage:
Deforest
it
= α
i
+ φ
t
+ δ
1
Credit
it
+ δ
2
P rices
it
+ δ
3
P riority
it
+ X
it
δ
4
+ �
it
(15)
where Def or e st
it
is deforested area in municipality i and year t,and
Credit
it
is the total
value of rural credit loans in municipality i and year t,instrumentedbytheinteraction
variable (Biome
i
∗ Post2008
t
). The terms α
i
, φ
t
, P rices
it
,andP riority
it
are defined
as in model (13), although the subscript t now indexes year. All regressions include the
term X
it
, which adds controls fo r the size of unobservable areas (or measurement error)
during the period of remote sensing.
The second stage specification alternatively uses model (14) as first stage, and is
defined analogously to model (15). In this case, however, the unit of observation is
the cell indexed by itk, where k ∈ {Pronaf, non-Pronaf}. The dependent variable is
now Def orest
it
,invarianttok. The variable of interest is
Credit
itk
,thetotalvalueof
rural credit loans in municipality i and year t,instrumentedbytheinteractionvariables
Biome
i
∗ Post2008
t
, N onpronaf
it
∗ Post2008
t
,andN onpronaf
it
∗ Biome
i
∗ Post2008
t
.
The identification hypo thesis in both 2SLS specifications is th at, conditioned upon
the control variables, instrumented credit is orthogonal to any latent determinant of
deforestation. Alternatively, the instrumental variables should be strongly correlated
with rural credit loans, but orthogonal to the error term in the second stage reg ressio n.
22
As arg ued above, this strategy is valid because Resolution 3,545 provides sources of
plausibly exo g eno us varia tion in rural credit loans in the Legal Amazon.
Resolution 3,545 was formally designed to restrict the concession of credit in the
Amazon Biome, with exceptions rendered to small producers. As argued in the previ-
ous section, these two dimensions of the resolution’s design provide potential sources of
exogenous variation in rural credit loans within the Legal Amazon.
Athirddimensionofitsdesignstrengthensthevalidityofusingtheresolution-induced
change in rural credit as an exogenous source of v ariation. Resolution 3,545 conditions
were such that borrowers who proved that they had the intention to comply with en-
vironmental regulation were allowed access to credit. This meant that producers who
feared the resolution might affect their future access to credit could signal an intent to
change their deforestation behavior in the future and be considered compliant with envi-
ronmental regulation at the present. This could invalidate the exclusion restriction of our
instrumental variable, si nce farmers who are not meeting environmental regulation at the
present alter their deforestation behavior for rea sons other than a concurrent reduction
in credit caused by Resolution 3,545. However, this introduces a bias that runs in the
opposite direction of our expected positive coefficient. After all, these producers will
suffer no credit effect (as their intention to comply makes them compliers), but still re-
duce deforestation, driving downwards the coefficient of interest. In terms of meeting the
resolution’s requirements, intention to comply is equivalent to compliance. Thus, there
were no other channels linking Resolution 3,545 and deforestation during the period of
interest. This eliminates a potential source of concern regarding the validity of using
the policy change as an instrument for credit and enables us to empirically examine the
relationship between credit and deforestation.
7. Policy Implementation and Effectiveness
This section evaluates the impacts of Resolution 3,545 on rural credit loans. We
start by describing the main results obtained using the empirical strategies detailed in
Section 6.1. We then explore heterogeneity and characterize the policy impact. Finally,
we discuss caveats and present robustness checks.
7.1. Credit Constraint
Table 2 presents the results for regressions based on model (13) (Panel A) and model
(14) (Panel B), using normalized rural credit at the municipality level as the dependent
variable. Coefficients in Panel A show that, conditioned upon controls, Resolution 3,545
was associated with a reduction in rural credit concession in the Amazon Biome, as com-
pared with the rest of the Legal Amazon. This effect is significant for total rural credit,
as well as for cattle and crop-specific loans. The impact on cattle-specific loans is larger
23
than that on crop-specific lo a ns, and the difference b etween their respective coefficients is
statistically significant. A plausible explanation for this difference is that cattle ranching
is relatively more land-intensive than crop farming, and therefore less compliant with
environmental regulation. In fact, previous studies show that three quarters of the land
cleared in the Legal Amazon have been used for cattle ranching-related activities, al-
though the relative participation of crop farming-related activities in cleared forest areas
has recently increased (see Chomitz and Thomas (2003) and Morton et al. (2006)).
Panel B corroborates the findings of Panel A, reporting even larger impacts when
considering the resolution’s impact on d ifferent kinds of credit takers. For a given mu-
nicipality in the Amazon Biome, credit for the non-Pronaf category decreased relatively
more than for the Pronaf category. These results are to be expected, given that Resolu-
tion 3,545 and associated legislation exempted small-scale producers - particularly Pro na f
beneficiaries - from the more restrictive conditions.
In Table 3, we present results from a counterfactual analysis to quantify the magnitude
of the impact. Our estimates indicate that, in the absence of the policy, total rural credit
and cattle-specific credit in the Amazon Biome would have been much greater than was
actually observed from 2008 onwards. Based on coefficients from Panel A, in which the
control group is composed of municipalities outsid e the Amazon Biome, we estimate that
approximately BRL 2.9 billion (USD 1.4 billion) were not loaned in the 2008 through
2011 period due to restrictions imposed by Resolution 3,545. This is equivalent to about
BRL 725 million (USD 350 million) less credit p er year. The reduction in cattle-specific
credit l oans accounts for 90% of this difference. Estimates obtained from comparing
the resolution’s impact on Pro na f and non-Pronaf credit are very similar, although the
relative role of cattle-specific loans is slightly smaller in this simulation.
7.2. Heterogeneity
Having estimated a significant impact of Resolution 3 ,5 4 5 on the concession o f rural
credit in the Amazon Biome, we are now interested in exploring potential heterogeneous
effects arising from sectoral heterogeneity. Using the cattle-oriented and crop-oriented
subsamples described in Section 5.1, we test whether the resolution’s impact differed
among municipalities with different leading econo mic activity. These restricted samples
further allow us to test whether our estimated coefficients have been jeopardized by
comparing municipalities that are not, in fact, economically comparable.
Table 4 presents results obtained by reproducing the specifications of Table 2 us-
ing the restricted cattle and crop-oriented subsamples. The significant negative coef-
ficient estimated for our variable of interest in the cattle-oriented subsample confirms
that Resolution 3,545 reduced cattle-specific loans inside the Amazon Biome, even when
the comparison is made using only cattle-o riented municipalities both inside a nd outside
the biome. This supports our main results, providing further evidence that the credit
24
constraint was caused by the policy change. Results are similar for the crop-oriented
subsample. In this case, however, restricting the sample to municipalities that are eco-
nomically more alike has highlighted the policy impact, as estimated coefficients are even
higher tha n in our original specifica tio ns.
We also consider the distribution of loan size to analyze the impact of heterogeneity
along a different dimension. The dependent variable is now the number of credit con-
tracts in each municipality categorized according to contract size. This exercise uses the
specification that takes all municipalities in the Amazon Biome as the treatment group,
and all Legal Amazon municipalities outside the biome as the control group. We start
by dividing credit contracts into three categories based on their size: small (up to the
median), medium (between the median and the 75
th
percentile), and large (above the
75
th
percentile). We then aggregate these contracts by municipality to use as dependent
variable. Given that small producers benefitted from less stringent conditions for credit
concession, while medium and large producers faced more restrictive conditions, we ex-
pect Resolution 3,545 to have a negative impact on the number of medium and large
contracts, and a neutral impact on small contracts. In fact, a positive impact on small
contracts could also be expected, should credit agents choose to reallocate resources away
from the more restricted group of credit takers and towards small producers.
Results shown in Table 5 indicate that, as expected, Resolution 3,545 had a significant
negative impact on the number of medium and large cattle-specific credit contracts. The
effect on crop-specific contracts, which had been small when estimated in specifications
using normalized rural credit as the dependent variable, is now significant and negative
only for medium credit contracts. The absence of a significant negative impact on small
producers is to be expected, but the coefficient estimated for the large producers shows
that, contrary to what was originally thought, large-scale crop producers were also not
affected by the conditional rural credit policy. This might be because they could more
easily meet the conditions required in Resolution 3,545, be it due to their better orga-
nizational capacity o r to their greater access to resources needed to follow through with
the regularization procedure. After all, in regions where crop pro duction is predominant
in the Amazon Biome, rural economic activities are mostly based on larg e-sca le soybean
farmers, who might have other sources of credit financing and a large organized chain
of production. Table 5 shows, moreover, that the resolution had a significant positive
effect on small cattle-specific credit contracts. This corroborates the hypoth esis stating
that Resolution 3,545 had a distributio nal e ffect, leading credit agents to change their
allocation of resources, moving it away from the group of credit takers subject to the
resolution’s conditions and towards the group that received legal exemptions.
Overall, the results obtained so far show that Resolution 3,545 produced differentiated
effects within the Amazon Biome. While the policy change led to a reduction in the
25
number of medium and large cattle-specific contracts and in the number of medium crop-
specific contracts, it had no impact on both large and small crop-specific loans, and a
positive impact on small cattle-specific loans. The resolution also appears to have led
to greater credit reduction in municipalities where cattle ranching is the main economic
activity, though the impact on rural credit in municipalities where crop production is the
main eco no mic activity is not negligible.
7.3. Caveats and Robustness Checks for Credit Results
Although our results are generally consistent with Resolution 3,545’s institutional
context, we run a series of tests to check their robustness. We focus on three sources of
potential concern. First, it could be that our regressions capture a spurious effect due to
the definition of the intervention and comparison groups that we erroneously attribute
to the policy change. Second, our identification strategy relies on the hypothesis that,
after controlling for observable characteristics and municipality and time fixed effects,
both intervention and control groups are comparable. Yet, municipalities in different
regions could differ in terms of regional economic dynamics or non-observable regional
characteristics. In this sense, comparing municipalities that are near to the Amazon
Biome frontier with those that are far from it could jeopardize our results. Third, the
use of a normalized depen dent variable could be driving our results.
We tackle these issues in three sets of robustness checks. First, we explore the res-
olution’s conditions - namely, its restriction to the Amazon Biome and the exemptions
created for small producers - to perform falsification tests. We start by considering the
specifications presented in Table 2, Panel A, in which municipalities inside the Amazon
Biome are taken as the treatment group and compared to Legal Amazon municipalities
outside the biome. In the first falsification test, we rep eat the exercise using the amount
of credit loaned strictly to Pronaf beneficiaries as the dependent variable. As this group
of borrowers benefitted from the aforementioned institutional exemptions, we expect this
falsification test to capture no significant impact of Resolution 3,545 on Prona f credit
inside the biome. If anything, the test could return a positive significant impact of the
resolution on Pronaf credit, should its distributional impact actually have caused a shift
of credit towards unrestricted small producers inside the biome, as discussed in Section
7.2. We then move on to the specifications presented in Table 2, Panel B, in which we
compare Pronaf and no n-Pro na f credit inside and outside the Amazon Biome. In the
second falsification test, we again repeat the specifications, but restrict our sample to
Legal Amazon municipalities located outside the biome. As Resolution 3,5 45 conditions
did not apply to the Legal Amazon as a whole, we expect this falsification test to capture
no significant negative impact of the resolution on Pronaf and non-Pronaf credit outside
the biome.
26
Panels A.1 and B.1 of Table 6 present the results for the two falsification tests. In Panel
A.1, we note that the coefficient for the Biome ∗ Post2008 variable is now insignificant,
as expected. When using crop-specific contracts, the coefficient is positive, although
relatively small, indicating that a small shift in allocation of financing resources towards
Pronaf beneficiaries did occur for crop-specific loans. In Panel B.1, the coefficient of
interest becomes non-negative, a s expected. In fact, when focusing on cattle-specific
contracts, results indicate that non-Pronaf credit was increasing more than for Pronaf
beneficiaries. Interestingly, should this pattern also apply to non-Pronaf credit inside the
Amazon Bio me, the real impact of Resolution 3,545 could be even higher than we have
estimated.
Our second set of robustness checks tests if results have been driven by regional or
economic differences between municipalities. To do this, we create a subsample restricted
to municipalities that are within 100 kilometers of the Amazon Biome border. Treatment
and control groups still refer to Legal Amazon municipalities inside and outside the
biome, respectively, but now both treatment and control municipalities must meet the
maximum distance to biome border criteria. This subsample contains municipalities that
are geographically closer to one another, and are thus thought to b e more alike across
both observable and non-observable fixed characteristics and trends.
Panel A.2 and B.2 in Table 6 show the results for this second robustness check.
Specifications are analogous to those of Table 2. Robustness results shown in Panel A.2
are consistent with those of our main specifications and estimated coefficients are, in fact,
higher. This suggests that municipa lities closest to the biome frontier, which are probably
in a more economically dynamic region, are more heavily dependent on credit and were
thus more affected by the conditions established in Resolution 3,545. Moreover, it seems
plausible that, in a region with more dynamic agricultural production, producers are
less compliant with environmental regulations. Estimated coefficients of interest remain
negative and significant in Panel B.2, except in the specification for crop-specific loans,
which is now less significant, although of magnitude similar to that of Table 2.
The third and final robustness check consists of replacing the normalized credit vari-
able with an absolute measure of total rural credit to test if our results have been driven
by inaccuracies introduced via the normalization of the dependent v ariable. Results are
presented in Panels A.3 and B.3 of Table 6, again using the specifications of Table 2.
Estimated coefficients are essentially the same as those obtained in our main regressions.
Overall, the robustness of our results support the specifications chosen for our main
regressions, as well as the interpretation of our results.
27
8. Credit Constraint and Deforestation
This section presents the results of the second stage of our 2SLS strategy, that is, the
impact of the credit constraint on deforestation in the Amazon Biome. As mentioned
in Section 1, the directio n of the effect of a reduction in credit on deforestation depends
on how rural credit is used. If used to improve production techniques and intensify
productivity per unit of land used for agricultural production, a credit restriction could
limit productivity gains and thereby generate an incentive for producers who seek to
expand their production to move into new areas. If, however, credit is used to expand
production at the extensive margin - to clear forest areas and accommodate a growing
herd, for example - the expected result of a reduction in credit should be a decrease in
deforestation. Which of these mechanisms prevails in the Ama zo n Biome is an empirical
question.
We can also think about our regressions as an econometric test ab out the existence of
binding credit constra int in activities related to deforestation. The usual way to assess if
afirmiscreditconstrainedintermsofinvestment,forinstance,istomeasureifthefirm
increases its amount of investment following a policy change that facilitates its access
to credit (Banerjee and Duflo (2012)). Sh ou ld the firm do so, it had not yet reached
its optimal amount of investment before the policy - the firm faced credit constraints.
The arg ument we make here is analogous to that of the credit constrained firm, but runs
in the opposite direction. If a deforester decreases the amount of forest cleared due to
arestrictioninsubsidizedcredit-meaninghewouldincreasedeforestationifhehad
more subsidized credit - then the deforester is credit constrained. In other words, the
deforester requires access to credit to implement his activities, be it the actual clearing
of forest or activities practiced after the forest area has been converted. If he is changing
his investment (deforestation) behavior as a response to a reduction in the availability of
subsidized credit, then he is not substituting the lost subsidized credit for market credit,
which serves as evidence that he is credit constrained.
At the same time, if farmers are decreasing the amount of deforestation in response to
a reduction in subsidized credit availability, it means that, within the theoretical frame-
work discussed in Section 4, they are not switching from the modern to the traditional
technology. Rather, they a re adjusting their optimal farmland decision within regions of
fixed technology. Should they be changing between technologies, we would observe an
increase in deforestation as a respo nse to a reduction in availability of subsidized credit.
8.1. Main Results
Table 7 presents results for the evaluation of how Resolution 3,5 4 5 affected deforesta-
tion in the Amazon Biome. Column 1 displays coefficients estimated in a fixed effects
specification without the use of instrumental variables (IV). The coefficient capturing the
28
impact of rural credit on deforestation is positive, but very small. As discussed in Section
6, however, these specifications suffer from an endogeneity problem, due both to omitted
variables and simultaneity. The IV approach is used to tackle this problem. In column
2, we present coefficients estimated in IV regressions that instrument rural credit by the
policy variable Biome ∗ Post2009.Resultssuggestthatcredithasapositiveandstrongly
significant relationship with defo restation, and that the reduction in the concession of
rural credit in the Amazon Biome ca used by Resolution 3,545 contributed to the curbing
of deforestation in the biome. In particular, municipalities that were most affected by the
resolution-induced credit reduction were also the ones that presented the sha rper drops
in deforestation. Similar results, shown in column 3 are obtained when using the triple
interaction term Nonpronaf ∗ Biome ∗ Post2009 as an instrumental variable, in addition
to the varia bles Biome ∗ Post2009 and Nonpronaf ∗ Post2009.
To better grasp the economic significance of our results, we conduct counterfactual
simulations analogous to those presented in Section 7.1 but now using the specification
of Table 7, column 2. Results shown in Table 8 indicate that, in the absence of Resolu-
tion 3,545, deforestation in the Amazon Biome would have been 2 ,7 83 square kilometers
greater than was actually observed in the 2009 through 2011 period. This is equiva lent
to an increase of about 18% over observed deforestation. In 201 0, for example, deforesta-
tion would have totaled 7,398 square kilometers had the resolution not been introduced,
compared to the 5,657 square kilometers that were actually observed. This result is
particularly impressive if we take into consideration the comparatively low deforestation
rates reco rded during the same period.
Our results serve as evidence of the existence of binding credit constraints in the
Amazon Biome. Farmers appea r to have responded to a reduction in the availability of
subsidized credit by changing their optimal allocation of resources and thereby reducing
deforestation. Were there no binding credit constraints, farmers’ actions would not have
resulted in a change in deforestation in the post-policy period. Moreover, our results
suggest that the prevailing mechanism relating rural credit and forest clearings in the
Amazon Biome is that in which credit is used to expand production by operating in the
extensive margin of land use, and not by increasing productivity. The predominance of
cattle ranching in the region and the correlation between this activity and extensive land
use in the Amazon could explain these results. Intensification of land use for crop farming
in Brazil is also much more develop ed than for ca ttle ranching.
8.2. Heterogeneity
To test whether the relationship between credit and deforestation depends on regional
heterogeneity, particularly that of leading economic activity, we repeat the empirical exer-
cise of Section 8.1 using cattle a nd crop-oriented municipalities. This allows to investigate
29
if different types of economic activity use credit differently, increasing production either
at the extensive margin or at the intensive margin.
Table 9 presents heterogeneity results. Coefficients estimated for cattle-oriented mu-
nicipalities, shown in Panels A.1 and B.1, are very si milar to those of Table 7, confirming
the positive relationship between credit and deforestation. The reduction in credit conces-
sion caused by Resolution 3,545 therefore implied a reduction in deforestation in munici-
palities where cattle ranching predominates. Yet, coefficients estimated for crop-oriented
municipalities, shown in Panels A.2 and B.2, indicate that rural credit has no impact
on deforestation. As has been documented before (see FAO (2007), crop production in
Brazil underwent several technological improvements, allowing pro duction to increase in
the intensive margin. If farmers are able to increase production via intensification, they
do not use credit to clear new land for production. In this case, chang es in rural credit
do no t affect deforestation.
The results can also be regarded as evidence that crop farmers are not credit con-
strained. They may have compensated the reduction in subsidized rural credit with
an increase in other sources of financing (market credit), thus maintaining their pre-
resolution levels of investment, farmland and deforestation. Cattle ranchers, on the other
hand, seem to be credit constrained (or at least became constrained after the policy
change), since they reduce the amount of deforestation in response to the reduction in
the availability of credit.
8.3. Robustness Checks
The concerns mentioned in Section 7.3 also apply to our second-stage regressio ns. As
the Amazon is an extremely large area, municipali ties in the treatment groups system-
atically differ f rom those in the control groups. To tackle this issue, we run robustness
checks using the subsample of municipalities within 100 kilometers of the biome border.
Results for this test, shown in Panels A.1 and B.1 of Table 10, indicate that no t only are
estimated coefficients significant, but also greater in magnitude. As the frontier covers
an area with very high deforestation rates - it contains a large fraction of the so-ca lled
"Arc of Deforestation," deforestation hotspots in the Brazilian Amazon - this result is to
be expected. As argued in Section 7.3, the economic dynamics of this region likely makes
this area more dependent on rural credit. An exogenous reductio n in rural credit would
therefore have a higher impact on agricultural activities in the region, and thereby more
strongly affect deforestation.
To test whether our results are driven by the use of the normalized variables, we
also repeat 2SLS estimations using absolute values for the deforestation and rural credit
variables. Results presented in Panels A.2 and B.2 of Table 10 show that coefficients
estimated using IV regressions remain positive and significant, although their magnitude
varies according to the specification.
30
Finally, to test whether our results are driven by a natural convergence of high to low
deforestation rates, we control for an interaction between a non-linear trend and the 2002
deforestation rates in each municipality. If the results are driven only by the convergence
process, our main coefficient should become zero. Results presented in Panels A.3 and B.3
of Table 10 show that coefficients remain positive and significant even when we control
for these trends. First stage results are also significant when controlling for these trends,
indicating that our instruments are not weak. These estimates corroborate the idea that
our results are not driven by a natural process of convergence.
The robustness tests conducted support our main specifications and interpretation of
results. The significa nt reduction in rural credit concession caused by Resolutio n 3,545
seems to have played an important role in curbing forest clearings in the Amazon Biome
in the late 2000s and early 2010s.
9. Final Comments
In this work, we investigate the reduction in the availability of credit implied by
Resolution 3,545. We focus on key aspects of the implementation and consequences
of this novel credit policy, exploring the associated exogenous variation in rural credit
concessions to empirically evaluate the resolution’s impact on both rural loans and forest
clearings.
We document that credit takers anticipated the credit constraint imposed by Resolu-
tion 3,545, but that the policy change did, in fact, lead to a reduction in the concession of
rural credit in the Amazon Biome. Counterfactual simulations suggest that, in the 2008
through 2011 period, approximately BRL 2.9 billion (USD 1.4 billion) were not loaned
due to restrictions imposed by the resolution. This result was largely driven by a reduc-
tion in cattle-specific loa ns. Resolution 3,545 also ca used a decrease in total amo unt of
non-Pronaf credit, as compared to Pronaf credit, within the biome. This is to be expected
in light of the legal exemptions that were introduced for small-scale producers regarding
legal requirements to access rural credit.
Estimations from instrumental variable regressions further show that the resolution-
induced restriction in credit helped contain deforestation in the Amazon Biome. This
result sug g ests that the expansion o f agriculture at the extensive margin in the biome
is financially constrained. Counterfactual simulations indicate that over 2,700 squa re
kilometers of forest would have been cleared from 2009 through 2011, had Resolution
3,545 not been implemented. Considering that deforestation rates in the late 2000s and
early 2010s were around 7,000 square kilometers per year, the effect attributed to the
resolution is quite substantial.
The results have two key policy implications. First, the evidence shows that condi-
tional rural credit can be an effective p olicy instrument to combat deforestation. Along
31
these lines, the differential effects across sectors and regions suggest that it might comple-
ment rather than substitute other conservatio n efforts. The pre-existent socioeco no mic
circumstances matter - credit reduction came mostly from the reduction of cattle loans
rather than crop loans. The implementation details also matter. The lag between the
announcement and enforcement of the resolution induced farmers to anticipate credit in
2008, mitigating part of the effect. Also, less stringent requirements and exemptions have
determined that large producers were more affected than small producers.
Second, our analysis suggests that the financial environment in the Amazon is charac-
terized by significant credit constraints. Especially in municipalities where cattle ranching
is the predominant activity, fewer resources correspond with less deforestation. This is a
key finding with implications for po licy design. In particular, policies that increase the
av ailability of financial resources (for example, payments for environmental services) may
lead to higher defo resta tio n rates, depending on the economic environment and exist-
ing resources in the area. Our results do not suggest that these policies will necessarily
increase defo resta tio n, but that these policies should take into account the na ture of finan-
cial constraints that are prevailing in the Amazon, avoiding potentially adverse rebound
effects.
Acknowledgments
Arthur Bragança, Luiz Felipe Brandão, Pedro Pessoa and Ricardo Dahis provided
excellent research assistance. We thank the Ministry of the Environment, particularly
Roque Tumolo Neto, for their continuous support. We are also grateful to Arthur Bran-
gança, Dimitri Szerman, Jo a na Chiavari, and Pedro James Hemsley for helpful comments.
References
Alston, L. J. and Andersson, K. (2011). Reducing Greenhouse Gas Emissions by Forest Protection: The
Transaction Costs of REDD. Working Paper 16756, The National Bureau of Economic Research.
Angelsen, A. (2010). Policies for Reduced Deforestation and Their Impact on Agricultural Production.
Proceedings of the National Academy of Sciences,107(46):19639.
Angelsen, A. and Wertz-Kanounnikoff,S.(2008). Moving Ahead with REDD: Issues, Options and Im-
plications. Center for International Forestry Research (CIFOR).
Assunção, J., Rocha, R., and Gandour, C. C. e. (2011). Deforestation Slowdown in the Legal Amazon:
Prices or Policies? Working Paper 1.
Banerjee, A. V., M. K. and Duflo, E. (2012). Do firm want to borrow more? testing credit constraints
using a directed lending program. Mimeo, MIT.
Binswanger, P. H. (1991). Brazilian policies that encourage deforestation in the amazon. World Devel-
opment,19(7):821–829.
Brasil, Ministério da Agricultura, Pecuária e Abastecimento (2001). Plano Agrícola e Pecuário 2001–
2002.SecretariadePolíticaAgrícola,Brasília.
32
Brasil, Ministério da Agricultura, Pecuária e Abastecimento (2003). Plano Agrícola e Pecuário 2003–
2004.SecretariadePolíticaAgrícola,Brasília.
Brasil, Ministério da Agricultura, Pecuária e Abastecimento (2006). Plano Agrícola e Pecuário 2006–
2007.SecretariadePolíticaAgrícola,Brasília.
Brasil, Ministério da Agricultura, Pecuária e Abastecimento (2011). Plano Agrícola e Pecuário 2011–
2012.SecretariadePolíticaAgrícola,Brasília.
Burgess, R. and Pande, R. (2005). Do rural banks matter? evidence from the indian social banking
experiment. American Economic Review,95:780–795.
Chomitz, K. and Thomas, T. (2003). Determinants of Land Use in Amazônia: A Fine-Scale Spatial
Analysis. American Journal of Agricultural Economics,85(4):1016–1028.
Conning, J. and Udry, C. (2007). Rural Financial Markets in Developing Countries. In The Handbook
of Agricultural Economics, Vol. 3.
Conselho Monetário Nacional (2008). Resolução 3.545 de 29 de Fevereiro de 2008.
FAO (200 6) . G lob al For est Reso urc es As ses sme nt 200 5: Pr ogr es s Towards Su st a in abl e Fore st M an age -
ment. Rome: Food and Agriculture Organization (FAO).
FAO (200 7) . Fu t ur e e x pa nsi on of s oy b ea n 2 00 5 -2 014 : imp li c at ion s f or fo o d s ecu ri ty, su st ain abl e r ura l
development and agricultural policies in the countries of mercosur and bolivia. Technical report, FAO
Regional Office for Latin America and the Caribbean.
Feder, G. (1985). The Relation Between Farm Size And Farm Productivity: The Role Of Family Labor,
Supervision And Credit Constraints. Journal of Development Economics,18(2-3):297–313.
Hargrave, J. and Kis-Katos, K. (2010). Economic Causes of Deforestation in the Brazilian Amazon: A
Panel Data Analysis for 2000s. In Proceedings of the German Development Economics Conference,
Hannover. Verein für Socialpolitik, Research Committee Development Economics.
INPE (2012). Projeto prodes - monitoramento da floresta amazônica brasileira por satélite. Technical
report, INPE. http://www.obt.inpe.br/prodes/index.php.
IPAM (2009). Evolução na Política para o Controle do Desmatamento na Amazônia Brasileira: O
PPCDAm. Clima e Floresta,15.
Ipea, Cepal, and GIZ (2011). Avaliação do Plano de Ação para a Prevenção e Controle do Desmatamento
da Amazônia Legal. Technical report.
Morton, D. C., DeFries, R. S., Shimabukuros, Y. E., Anderson, L. O., Arai, E., Espirito-Santo, F.,
Freitas, R., and Morisette, J. (2006). Cropland Expansion Changes Deforestation Dynamics in the
Southern Brazilian Amazon. Proceedings of the National Academy of Sciences,103(39):14637Ű–14641.
Pfaff,A.S.(1999). WhatDrivesDeforestationintheBrazilianAmazon? EvidencefromSatelliteand
Socioeconomic Datal. Journal of Environmental Economics and Management,37(1):26–43.
Presidência da República (2006). Lei No. 11.326 de 24 de julho de 2006.
Reis, E. and Guzmán, R. (1994). An Econometric Model of Amazon Deforestation. In K. Brown and
D. Pearce, eds. The Causes of Tropical Deforestation. London: UCL Press,pages172–191.
Reis, E. and Margulis, S. (1991). Options for Slowing Amazon Jungle Clearing. In R. Dornbusch and
J.M. Poterba, eds. Global Warming: Economic Policy Responses. Cambridge, MA: MIT Press,pages
335–375.
Rosenzweig, M. and Wolpin, K. I. (1993). Credit Market Constraints, Consumption Smoothing, and
the Accumulation of Durable Production Assets in Low-Income Countries: Investments in Bullocks
in India. Journal of Political Economy,101:223–244.
Santilli, M., Moutinho, P., Schwartzman, S., Nepstad, D., Curran, L., and Nobre, C. (2005). Tropical
Deforestation and the Kyoto Protocol. Climatic Change,71:267–276.
Udry, C. (2010). The economics of agriculture in africa: Notes toward a research program. Mimeo, Yale.
33
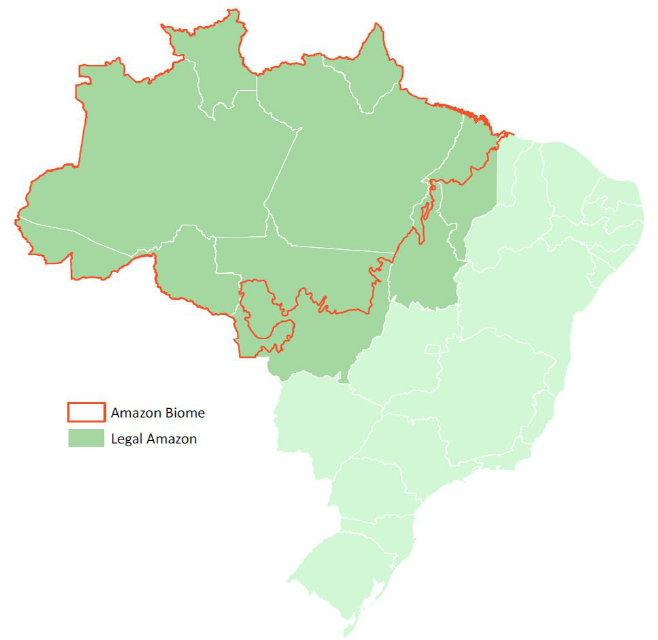
Figure 1: The Brazilian Amazon Biome and Legal Amazon
34
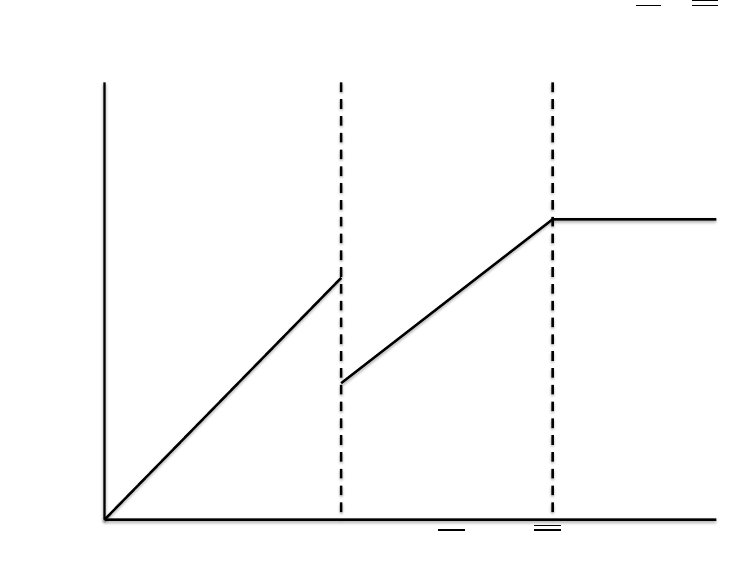
Figure 2: Theoretical Model - Optimal Farmland Size (M
0
< M<M)
!"#$%&'
&%()'*+,-'
M
M
M
M
0
./%)+#!(%&'
.-01(!&!23'
40!(*./%+(-)5'
$!)-/('
.-01(!&!23'
40!(*./%+(-)5'
$!)-/('
.-01(!&!23'
46(0!(*./%+(-)5'
35
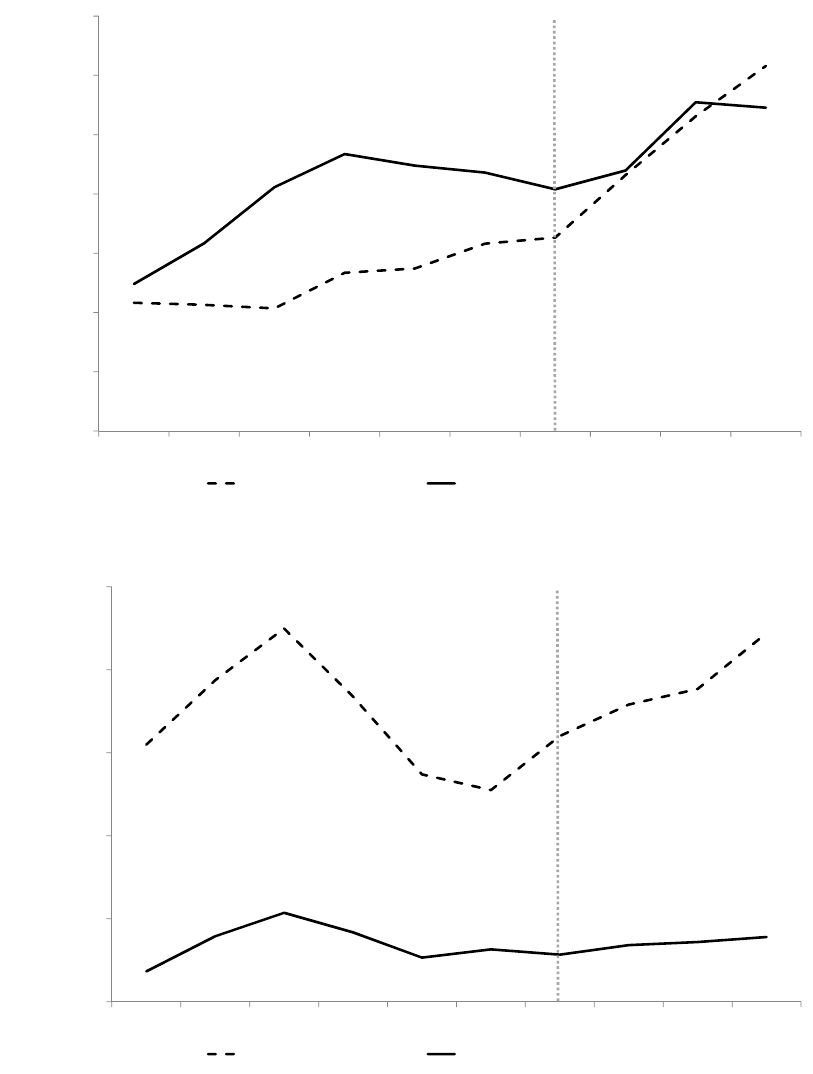
Figure 3: Annual Concession of Rural Credit in the Legal Amazon (municipality-level
average value of rural credit loans, 2002-2011)
(a) Cattle-oriented sample
!""
#""
$""
%""
&""
!"#$%&'()*+'&,-./01$2
"
'""
(""
(""( (""! (""# (""$ (""% (""& ("") (""* ("'" ("''
+,-./0123456+728/+41
/7./0123456+728/+41
(b) Crop-oriented sample
!"###
!"$##
%"###
%"$##
!"#$%&'()*+'&,-./01$2
#
$##
%##% %##& %##' %##$ %##( %##) %##* %##+ %#!# %#!!
,-./01234567,8390,52
08/01234567,8390,52
Notes: Authors’ elaboration based on data from Recor/Central Bank.
36
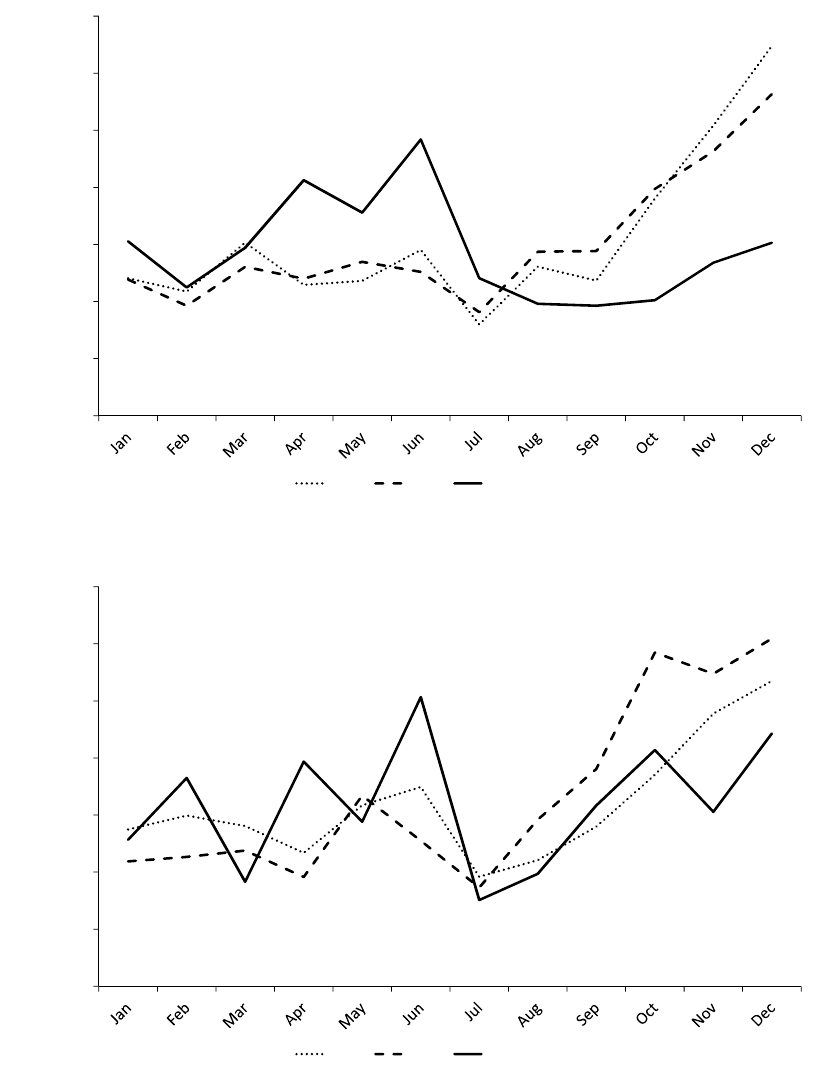
Figure 4: Monthly Concession of Rural Credit in the Amazon Biome (total value of rural
credit loans, 2006-2008)
(a) Cattle-specific contracts
!"#
$##
$"#
%##
%"#
!"#$%&'()*+',%--%./0
#
"#
!##
$##&
$##'
$##(
(b) Crop-specific contracts
!"
#"
$""
$%"
$&"
!"#$%&'()*+',%--%./0
"
%"
&"
%""!
%""'
%""#
Notes: Authors’ elaboration based on data from Recor/Central Bank.
37

Figure 5: Deforestation in the Legal Amazon (municipality-level average deforestation,
2002-2011)
(a) Cattle-oriented sample
!
"
#
$
%
&
'(
)(
!(
"(
#(
$(
%(
!"#$%"&'"!()%")(*+,
-
.
(
'
*
)
(
'(
*(
)(
*((* *(() *((! *((" *((# *(($ *((% *((& *('( *(''
+,-+./012345,06+52/078/9:03;+-<
5=:-+./012345,06+52/07>+?@:03;+-<
(b) Crop-oriented sample
!
"
#
$
%
&
'(
'"
)(
)"
*(
*"
!(
!"#$%"&'"!()%")(*+,
-
.
(
'
)
*
(
"
'(
'"
)(() )((* )((! )((" )((# )(($ )((% )((& )('( )(''
+,-+./012345,06+52/078/9:03;+-<
5=:-+./012345,06+52/07>+?@:03;+-<
Notes: Authors’ elaboration based on data from PRODES/INPE.
38

Table 1: Municipality-Level Average Annual Rural Credit and Deforestation Before and After Resolutio n 3,545 (credit in BRL thousand
by type of contract; deforestation in km
2
)
Aggregate Credit Pronaf Credit Non-Pronaf Credit
Deforestation
Total Cattle Crop Total Cattle Crop Total Cattle Crop
Panel A: All municipalities
Inside biome Pre-resolution 5,509 3,531 1,978 1,254 841 413 4,255 2,690 1,565 40.36
Post-resolutio n 6,3 6 0 4,429 1,9 3 0 1,976 1,458 518 4,383 2,97 1 1,413 14.90
Outside biome Pre-resolution 12,092 2,865 9,227 784 475 309 11,308 2,390 8,918 3.03
Post-resolutio n 15,594 5,371 10,223 1,110 776 334 14,484 4,595 9,8 8 9 1.72
Panel B: Cattle-oriented municipalities
Inside biome Pre-resolution 5,799 4,655 1,144 1,581 1,152 430 4,218 3,504 714 49.57
Post-resolutio n 6,9 5 4 5,843 1,1 1 0 2,396 1,941 455 4,558 3,90 2 656 18.07
Outside biome Pre-resolution 4,865 2,987 1,878 757 490 267 4,108 2,497 1,611 2.64
Post-resolutio n 7,8 9 4 5,715 2,1 8 0 1,024 774 250 6,870 4,940 1,930 1.95
Panel C: Crop-oriented municipalities
Inside biome Pre-resolution 5,841 1,620 4,221 738 289 449 5,103 1,3 3 1 3,772 21.60
Post-resolutio n 6,1 2 7 2,010 4,1 1 8 1,352 613 739 4,775 1,397 3,379 8.27
Outside biome Pre-resolution 23,112 2,679 20,433 826 453 373 22,286 2,226 20,060 4.41
Post-resolutio n 27,334 4,848 22,486 1,242 780 462 26,093 4,068 22,025 0.90
Notes: Descriptive statistics for average values of annual rural credit are calculated using municipality-level data constructed from the Recor
contract-level microdata set. Statistics are shown for aggregate rural credit, and for Pronaf and Non-Pronaf credit separately. Descriptive
statistics for deforestation are calculated using municipality-level satellite-based deforestation data from PRODES/INPE. Figures in Panel A are
for the full, unrestricted sample; in Panel B for the cattle-oriented subsample; and in Panel C for the crop-oriented subsample.
39

Table 2: The Effect of Resolution 3,545 on Rural Credit in the Amazon Biome
Panel A: Biome as treatment group
Total Cattle Crop
Biome * Po st2008 -0.216 -0.289 -0.078
(0.029)*** (0.033)*** (0.024)***
Observations 85,440 85,440 85,440
Number of Municipalities 712 712 712
Year and Municipality FE Yes Yes Yes
Sample Legal Amazon Legal Amazon Legal Amazon
Panel B: Biome and non-Pronaf as treatment groups
Total Cattle Crop
Biome * Non-Pronaf * Post2008 -0.369 -0.407 -0.189
(0.039)*** (0.041)*** (0.033)***
Non-Pronaf * Post2008 0.064 0.116 -0.005
(0.030)** (0.031)*** (0.025)
Biome * Non-Pronaf 0.148 0.163 0.076
(0.016)*** (0.016)*** (0.013)***
Biome * Post2008 0.026 0.007 0.064
(0.030) (0.033) (0.025)***
Non-Pronaf -0.025 -0.046 0.002
(0.012)** (0.012)*** (0.010)
Observations 170,880 170,880 170,880
Number of Municipalities 712 712 712
Year and Municipality FE Yes Yes Yes
Sample Legal Amazon Legal Amazon Legal Amazon
Notes: Coefficients shown are estimated using fixed effects specifications in a municipality-by-
month panel data set covering the 2002 through 2011 period. The sample includes all Legal
Amazon municipalities that are not crossed by the Amazon Biome frontier. The dependent
variable is normalized rural credit at the municipality level calculated using all contracts (column
1), cattle-specific contracts only (column 2), and crop-specific contracts only (column 3). All
regressions include controls for municipality fixed effects, month-year fixed effects, cattle prices
(current and lagged), crop prices (current and lagged), and priority municipality status. Robust
standard errors are clustered at the municipality level. Significance: *** p<0.01, ** p<0.05, *
p<0.10.
40

Table 3: Counterfactual Simulations - The Effect of Resolution 3,545 on Rural Credit in the Amazon Biome (credit in BRL million)
Panel A: Biome as treatment group
Year
Total Cattle Crop
Observed Estimated Difference Observed Estimated Difference Observed Estimated Difference
2002 1,595 1,092 503
2003 2,306 1,312 994
2004 3,002 1,679 1,324
2005 2,982 1,945 1,037
2006 2,623 1,856 767
2007 2,630 1,818 812
2008 2,506 3,174 668 1,740 2,253 512 765 944 179
2009 2,772 3,594 821 1,845 2,564 719 927 1,079 152
2010 3,203 3,852 649 2,271 2,873 601 932 1,008 76
2011 3,170 3,928 758 2,258 3,037 779 912 945 33
2008-2011 Total 11,651 14,547 2,896 8,114 10,727 2,611 3,536 3,976 440
Panel B: Biome and non-Pronaf as treatment groups
Year
Total Cattle Crop
Observed Estimated Difference Observed Estimated Difference Observed Estimated Difference
2002 1,595 1,092 503
2003 2,306 1,312 994
2004 3,002 1,679 1,324
2005 2,982 1,945 1,037
2006 2,623 1,856 767
2007 2,630 1,818 812
2008 2,506 3,036 530 1,740 2,052 312 765 943 178
2009 2,772 3,607 835 1,845 2,449 604 927 1,085 158
2010 3,203 3,795 592 2,271 2,694 423 932 1,002 70
2011 3,170 3,905 736 2,258 2,886 628 912 933 21
2008-2011 Total 11,651 14,342 2,693 8,114 10,081 1,967 3,536 3,963 427
Notes: Counterfactual simulations are conducted using the sample, specifications and estimated coefficients from Table 2. Results shown are
for total rural credit (columns 1-3), cattle-specific contracts (columns 4-6), and crop-specific contracts (columns 7-9). Observed rural credit is
obtained from Recor/Central Bank and estimated rural credit is calculated by replacing the coe fficient of the policy variable by zero.
41

Table 4: Sectoral Heterogeneity - Cattle-Oriented and Crop-Oriented Sub-
samples
Panel A: Biome as treatment group
Cattle-oriented Crop-oriented
Biome * Po st2008 -0.300 -0.128
(0.042)*** (0.040)***
Observations 54,600 27,960
Number of Municipalities 455 233
Year and Municipality FE Yes Yes
Sample Legal Amazon Legal Amazon
Panel B: Biome and non-Pronaf as treatment groups
Cattle-oriented Crop-oriented
Biome * Non-Pronaf * Post2008 -0.490 -0.246
(0.053)*** (0.060)***
Non-Pronaf * Post2008 0.193 -0.030
(0.040)*** (0.041)
Biome * Non-Pronaf 0.196 0.098
(0.021)*** (0.024 )* * *
Biome * Post2008 0.069 0.048
(0.041)* (0.042)
Non-Pronaf -0.077 0.012
(0.016)*** (0.016)
Observations 109,200 55,920
Number of Municipalities 455 233
Year and Municipality FE Yes Yes
Sample Legal Amazon Legal Amazon
Notes: Coeffi cients shown are estimated using fixed effects specifications in a
municipality-by-month panel data set covering the 2002 through 2011 period.
The cattle-oriented subsample includes Legal Amazon municipalities that are
not crossed by the Amazon Biome frontier where the pre-2008 average value of
annual credit loans for cattle ranching was higher than that for crop production;
the crop-oriented subsample is defined analogously. The dependent variable is
normalized rural credit at the municipality level calculated using cattle-specific
contracts only (column 1), and crop-specific contracts only (column 2). All re-
gressions include controls for municipality fixed effects, month-year fixed effects,
cattle prices (current and lagged), crop prices (current and lagged), and priority
municipality status. Robust standard errors are clustered at the municipality
level. Significance: *** p<0.01, ** p<0.05, * p<0.10.
42

Table 5: The Effect of Resolution 3,545 on the Distribution of Rural Credit Contracts by Contract Size
Number of cattle-specific contracts, by contra ct size Number of crop-specific contracts, by contract size
Small Medium Large Small Medium Larg e
Biome * Post2008 3.405 -0.798 -1.345 1.642 -0.486 0.107
(1.508)** (0.421)* (0.331)*** (1.757) (0.263)* (0.234)
Crops price index 2.486 -0.300 0.428 -0.872 0.641 -0.215
(3.938) (0.705) (2.458) (3.708) (0.529) (0.696)
Crops price index (lagged) 16.342 -1.823 0.951 1.294 0.232 3.368
(4.220)*** (0.805)** (0.735) (3.626) (0.760) (1.599)**
Cattle price index (1
st
sem) 0.286 -0.053 -0.344 0.342 -0.114 12.650
(0.148)* (0.055) (0.658) (0.173)** (0.041 )*** (2.959)***
Cattle price index (lagged) 0.295 0.064 -0.034 0.242 0.159 -0.029
(0.125)** (0.058) (0.059) (0.170) (0.035)*** (0.022)
Priority municipalities 1.190 -4.267 0.073 -1.142 -1.292 0.032
(4.305) (2.045)** (0.062) (6.908) (0.790) (0.030)
Observations 93,720 93,720 93,720 93,720 93,720 93,720
Number of Municipalities 781 781 781 781 781 781
Year and Municipality FE Yes Yes Yes Yes Yes Yes
Notes: Coefficients shown are estimated using fixed effects specifications in a municipality-by-month panel data set covering the 2002 through 2011 period. The
sample includes all Legal Amazon municipalities that are not crossed by the Amazon Biome frontier. The dependent variable is the number of small, medium, and
large cattle-specific contracts only (columns 1-3) and the number of small, medium, and large crop-specific contracts only (columns 4-6). All regressions include
controls for municipality fixed effects, month-year fixed effects, cattle prices (current and lagged), crop prices (current and lagged), and priority municipality
status. Robust standard errors are clustered at the municipality level. Significance: *** p<0.01, ** p<0.05, * p<0.10.
43

Table 6: Robustness Checks - Falsification Tests, Alternative Sample and Alternative Dependent Variable
Panel A.1: Falsification test - Panel A.2: Alternative sample - Panel A.3 : Alternative dependent variable -
Pronaf credit as dependent variable municipalities within 100km of biome frontier absolute values of rural credit
Total Cattle Crop Total Cattle Crop Total Cattle Crop
Biome * Post2008 0.036 0.014 0.064 -0.159 -0.199 -0.106 -277.415 -144.285 -133.130
(0.030) (0.032) (0.025)** (0.041)*** (0.046)*** (0.034)*** (57.051)*** (27.769)*** (49.758)***
Observations 85,440 85,440 85,440 46,320 46,320 46,320 85,440 85,440 85,440
Number of Municipalities 712 712 712 386 386 386 712 7 1 2 712
Year and Municipality FE Yes Yes Yes Yes Yes Yes Yes Yes Yes
Sample Legal Amazon Legal Amazon Legal Amazon <100km <100km <100km Legal Amazon Legal Amazon Legal Amazon
Panel B.1: Falsification test - Panel B.2: Alternative sample - Panel B.3: Alternative dependent variable -
subsample of Legal Amazon municipalities outside biome municipalities within 10 0km of biome frontier absolute values of rural credit
Total Cattle Crop Total Cattle Crop Total Cattle Crop
Biome * Non-Pronaf * Post2008 -0.096 -0.156 -0.047 -287.182 -186.752 -100.430
(0.057)* (0.060)*** (0.045) (57.198)*** (26.928)*** (50.230)**
Non-Pronaf * Post2008 0.064 0.116 -0.005 0.064 0.116 -0.005 237.473 158.671 78.801
(0.030)** (0.031)*** (0.025) (0.030 )* * (0.031)*** (0.025) (53.1 1 2)*** (21.711)*** (48.697)
Biome * Non-Pronaf 0.038 0.062 0.019 -626.448 -5.130 -621.319
(0.023)* (0.024)*** (0.018) (157.541)*** (26.126) (147.809)***
Biome * Post2008 -0.060 -0.057 -0.021 4.883 21.233 -16.350
(0.043) (0.046) (0.034) (12.823) (9.166)** (8.443)*
Non-Pronaf -0.025 -0.046 0.002 -0.025 -0.046 0.002 876 .9 7 5 159.534 717.441
(0.012)** (0.012)*** (0.010) (0.012)** (0.012)*** (0.010) (154.199)*** (20.239)*** (145.679)***
Observations 61,200 61,200 61,200 92,640 92,640 92,640 170,880 170,880 170,880
Number of Municipalities 712 712 712 386 386 386 712 712 712
Year and Municipality FE Yes Yes Yes Yes Yes Yes Yes Yes Yes
Sample Outside Biome Outside Biome Outside Biome <100km <100km <100km Legal Amazon Legal Amazon Legal Amazon
Notes: Coefficients shown are estimated using fixed effects specifications in a municipality-by-month panel data set covering the 2002 through 2011 period. The sample includes all Legal Amazon municipalities
that are not crossed by the Amazon Biome frontier, unless otherwise stated. Falsification tests are performed using normalized Pronaf rural credit as the dependent variable (Panel A.1) and a subsample of Legal
Amazon municipalities located outside the Amazon Biome (Panel B.1). Alternative specifications tested include using a restricted sample of municipalities within 100 km of biome frontier (Panels A.2 and B.2) and
absolute value of rural credit as the dependent variables (Panels A.3 and B.3). The dependent variables are calculated using all contracts (columns 1, 4 and 7), cattle-specific contracts only (columns 2, 5 and 8),
and crop-specific contracts only (columns 3, 6 and 9). All regressions include controls for municipality fixed effects, month-year fixed effects, cattle prices (current and lagged), crop prices (current and lagged), and
priority municipality status. Robust standard errors are clustered at the municipality level. Significance: *** p<0.01, ** p<0.05, * p<0.10.
44

Table 7: The Effect of Resolution 3,545 on Deforestation in the Amazon Biome (fixed effects and
2SLS regressions)
Panel A: Fixed effects and IV second stage
Fixed effects IV: Biome * Post IV: triple interaction
Total rural credit 0.026 0.700 0.148
(0.013)** (0.238)*** (0.036)***
Observations 5,750 5,750 10,571
Number of Municipalities 575 575 575
Year and Municipality FE Yes Yes Yes
Sample Legal Amazon Legal Amazon Legal Amazon
Panel B: IV first stage
IV: Biome * Post IV: triple interaction
Biome * Post2009 -0.385 0.126
(0.059)*** (0.061)**
Non-Pronaf * Post2009 0.196
(0.074)***
Biome * Post2009 * Non-Pronaf -0.949
(0.085)***
Observations 5,750 10,571
Number of Municipalities 575 575 575
Year and Municipality FE Yes Yes
Sample Legal Amazon Legal Amazon
Notes: Coefficients shown are estimated using fixed effects specifications in a municipality-by-year panel
data set covering the 2002 through 2011 period. The sample includes all Legal Amazon municipalities
that are not crossed by the Amazon Biome frontier and that showed variation in forest cover during the
period. Fixed effects OLS and second-stage 2SLS estimations are shown in Panel A, and first-stage 2SLS
estimations are shown in Panel B. IV models instrument rural credit by the policy variable from model 13
(column 2) or model 14 (column 3). All regressions include controls for municipality fixed effects, year fixed
effects, cattle prices (current and lagged), crop prices (current and lagged), priority municipality status,
clouds and non-observable areas during period of remote sensing. Robust standard errors are clustered at
the municipality level. Significance: *** p<0.01, ** p<0.05, * p<0.10.
45

Table 8: Counterfactual Simulations - The Effect of Resolution 3,545 on Deforestation in the
Amazon Biome
Year
IV: Biome * Post IV: triple interaction
Observed Estimated Difference Observed Estimated Difference
2002 21,549 21,549 18,810
2003 25,686 25,686 22,844
2004 23,087 23,087 19,176
2005 20,087 20,087 19,847
2006 9,946 9,946 10,717
2007 10,565 10,565 10,825
2008 11,295 11,295 12,252
2009 5,220 5,688 468 5,220 6,446 1,226
2010 5,657 7,398 1,741 5,657 7,390 1734
2011 5,119 5,693 574 5,119 5,219 101
2009-2011 Total 15,995 18,778 2,783 15,995 19,056 3,061
Notes: Counterfactual simulations are conducted using the sample, specifications and estimated co-
efficients from Table 7. Instruments used are Biome * Post (columns 1-3) and Biome * Post, Non-
Pronaf * Post, and Non-Pronaf * Biome * Post (columns 4-6). Observed deforestation is obtained
from PRODES/INPE and estimated deforestation is calculated by replacing the coefficient of the policy
variable by zero.
46

Table 9: The Effect of Resolution 3,545 on Defo restation in the Amazon Biome Using Cattle and Crop-Oriented Subsamples (fixed effects and 2SLS
regressions)
Panel A: Fixed effects and IV second stage
Panel A.1: Cattle-oriented municipalities Panel A.2: Crop-oriented municipalities
Fixed effects IV: Biome*Post IV: triple interaction Fixed effects IV: Biome*Post IV: triple interaction
Total rural credit 0.023 1.033 0.225 0.040 -0.212 -0.027
(0.015) (0.334)*** (0.051)*** (0.026) (0.308) (0.034)
Observations 4,120 4,120 7,904 1,410 1,410 2,593
Number of Municipalities 412 412 412 141 141 141
Year and Municipality FE Yes Yes Yes Yes Yes Yes
Sample Legal Amazon Legal Amazon Legal Amazon Legal Amazon Legal Amazon Legal Amazon
Panel B: IV first stage
Panel B.1: Cattle-oriented municipalities Panel B.2: Crop-oriented municipalities
IV: Biome*Post IV: triple interaction IV: Biome*Post IV: triple interaction
Biome * Post2009 -0.389 0.161 -0.353 0.041
(0.067)*** (0.069)** (0.129)*** (0.130)
Non-Pronaf * Post2009 0.279 -0.084
(0.083)*** (0.159)
Biome * Post2009 * Non-Pronaf -0.954 -0.894
(0.096)*** (0.180)***
Observations 4,120 7,904 1,410 2,593
Number of Municipalities 412 412 141 141
Year and Municipality FE Yes Yes Yes Yes
Sample Legal Amazon Legal Amazon Legal Amazon Legal Amazon
Notes: Coefficients shown are estimated using fixed effects specifications in a municipality-by-year panel data set covering the 2002 through 2011 period. The sample
includes all Legal Amazon municipalities that are not crossed by the Amazon Biome frontier and that showed variation in forest cover during the period. Samples are
restricted to cattle (Panels A.1 and B.1) and crop-oriented (Panels A.2 and B.2) municipalities. Fixed effects OLS and second-stage 2SLS estimations are shown in Panel
A, and first-stage 2SLS estimations are shown in Panel B. IV models instrument rural credit by the p olicy variable from model 13 (columns 2 and 5) or model 14 (columns
3 and 6). All regressions include controls for municipality fixed effects, year fixed effects, cattle prices (current and lagged), crop prices (current and lagged), priority
municipality status, clouds and non-observable areas during period of remote sensing. Robust standard errors are clustered at the municipality level. Significance: ***
p<0.01, ** p<0.05, * p<0.10.
47

Table 10: Robustness Checks - IV Regressions with Alternative Sample, Alternative Dependent Variable and Controlling for the Interaction Between a Non-Linear Trend and Initial Deforestation
Panel A - IV Seco nd Stage
Panel A.1: Alternative sample - Panel A.2: Alternative variables - Panel A.3: Controlling for the interaction
municipalities within 100 km of biome frontier absolute values of total rural credit and deforestation between a non-linear trend and initial deforestation
IV-Biome*Post IV- Triple interaction IV-Biome*Post IV- Triple interaction IV-Biome*Post IV- Triple interaction
Total Rural Credit 1.514 1.242 3.621 0.131 0.619 0.127
(0.602)** (0.413)*** (1.300)*** (0.039)*** (0.224)*** (0.034)***
Observations 2,510 4,868 5,750 10,610 5,750 10,571
Number of Municipalities 251 251 575 575 575 575
Year and Municipality FE Yes Yes Yes Yes Yes Yes
Sample <100km <100km Legal Amazon Legal Amazon Legal Amazon Legal Amazon
Panel B - IV First Stage
Panel B.1: Alternative sample - Panel B.2: Alternative variables - Panel B.3: Controlling for the interaction
municipalities within 100 km of biome frontier absolute values of total rural credit and deforestation between a non-linear trend and initial deforestation
IV- Biome*Post IV- Triple interaction IV- Biome*Post IV- Triple interaction IV- Biome*Post IV- Triple interaction
Biome * Post2009 -0.29 -0.081 -3.6 67 0.015 -0.376 0.131
(0.072)*** (0.076) (0.638)*** (0.833) (0.081)*** (0.085)
Non-Pronaf * Post 2009 0.196 2.594 0.196
(0.071)*** (1.014)** (0.092)**
Biome * Post2009 * N on-Pronaf -0.283 -3.615 -0.949
(0.105)*** (1.169)*** (0.111)***
Observations 2,510 4,868 5,750 10,610 5,750 10,571
Number of Municipalities 251 251 575 575 575 575
Year and Municipality FE Yes Yes Yes Yes Yes Yes
Sample <100km <100km Legal Amazon Legal Amazon Legal Amazon Legal Amazon
Notes: Co efficients shown are estimated using fixed effects sp ecifications in a municipality-by-month panel data set covering the 2002 through 2011 period. Second-stage 2SLS estimations are shown in Panel A,
and first-stage 2SLS estimations are shown in Panel B. IV models instrument rural credit by the policy variable from model 13 (columns 1, 3 and 5) or model 14 (columns 2, 4 and 6). Alternative specifications
tested include using a restricted sample of municipalities within 100 km of biome frontier (Panels A.1 and B.1); absolute value (instead of normalized value) of rural credit and deforestation variables (Panels A.2 and
B.2); and controlling for the interaction between deforestation initial values and a non-linear trend (Panels A.3 and B.3). All regressions include controls for municipality fixed effects, year fixed effects, cattle prices
(current and lagged), crop prices (current and lagged), priority municipality status, clouds and non-observable areas during period of remote sensing. Robust standard errors are clustered at the municipality level.
Significance: *** p< 0.01, ** p<0.05, * p< 0.10.
48
